
Direct Mail Statistics That Prove Print Converts


Response rates, ROI, formats, and B2B benchmarks, set against the order data behind 25 plus years of printing direct mail at 4OVER4.
Direct mail still drives real results in a world drowning in digital noise. Response rates beat email, decision-makers open and act on printed pieces, and physical mail earns more attention and recall than any digital format. With 150,000 plus businesses printing with 4OVER4.COM and 10 billion plus cards produced, the data backs up what marketers already feel: tangible mail works.
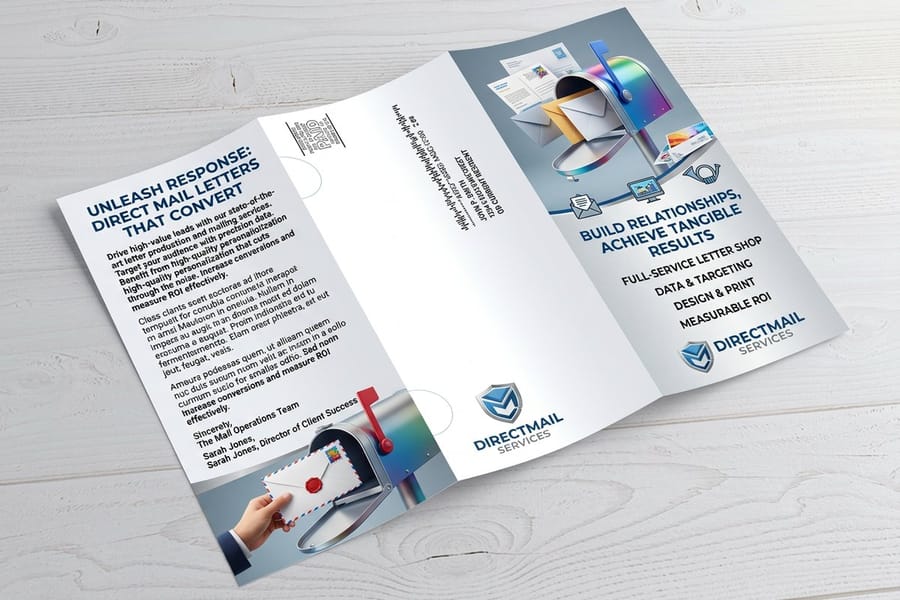
In brief
Direct mail response, ROI, and B2B reach in one read
Direct mail statistics paint a clear picture. Physical mail still drives real results in a world drowning in digital noise, and response rates outperform email by a wide margin. B2B direct mail statistics show that decision-makers open, read, and act on printed pieces more than any other channel. With 150,000 plus businesses trusting 4OVER4.COM for their print campaigns, the data backs up what marketers already feel. For acquisition campaigns and retention plays alike the pattern holds, and our Help Center is ready if you need guidance getting started with your next mailing.
Why it still matters
Why direct mail marketing statistics still matter in 2026
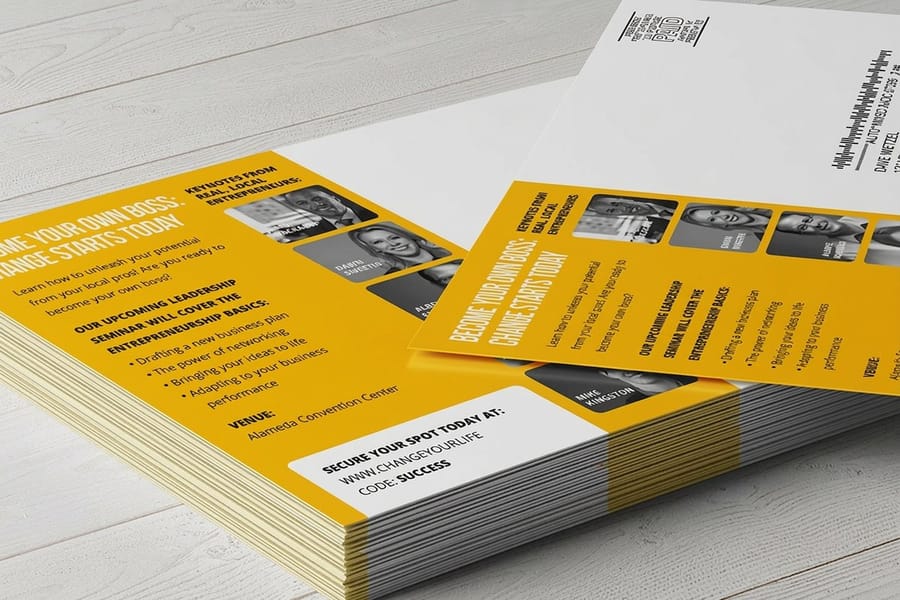
Direct mail statistics are not just numbers on a page. They are proof that physical marketing holds its ground against digital channels, and often wins. In a landscape where email open rates hover around 20 percent, direct mail consistently delivers higher engagement and stronger recall. 4OVER4.COM has printed over 10 billion cards for businesses that understand this reality.
If you are building a case for your next campaign, start with the hard data. Our breakdown of direct mail ROI shows exactly how physical mail stacks up dollar for dollar. And for a deeper look at engagement benchmarks, the direct mail effectiveness research we have compiled goes further still.
B2B direct mail statistics are especially telling. Business buyers respond to mail at rates that make digital marketers jealous. The sections below break down every angle, from response rates and ROI to format performance and industry-specific data, drawing on the most cited sources in the direct mail advertising space.

By the numbers
The four direct mail figures a media plan starts from
Here are the headline figures marketers reach for first when they plan a mailing, drawn from industry benchmarks and our own production data. Email open rates sit near 20 percent, while a physical piece earns more attention, longer reading time, and stronger recall. Set those benchmarks against 25 plus years of printing direct mail at 4OVER4.COM and the picture is consistent: the pieces people can hold get acted on.
Response, ROI and trust
Direct mail response rates, ROI, and performance data
Direct mail statistics cover a lot of ground, from response rates and return on investment to format comparisons and consumer behavior. Here is the full breakdown so you can make smarter decisions about your next campaign. 4OVER4.COM has worked with 150,000 plus businesses on direct mail pieces, and the patterns in the data are consistent year after year.
Response rate benchmarks for direct mail
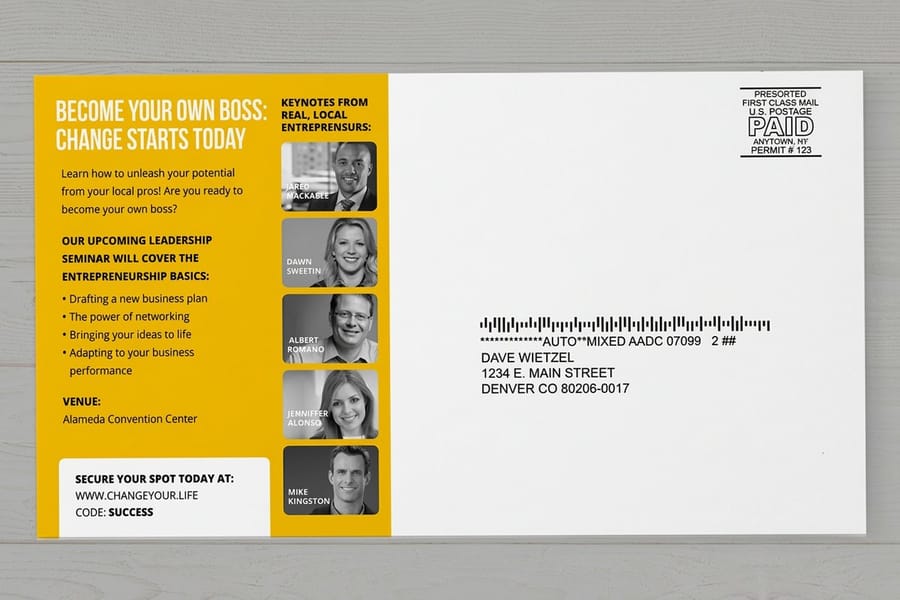
The average direct mail response rate sits a lot higher than email, paid search, or social media advertising. House lists, meaning your existing customers, pull even stronger numbers than prospect lists. That gap matters when you are calculating cost per acquisition.
Postcards tend to outperform letter-sized mailers for simple offers. They are cheaper to produce and cheaper to mail. But for complex B2B campaigns such as multi-page brochures or catalogs, longer formats give you room to tell a complete story. The format you choose should match your message.
We switched from email-only campaigns to adding postcards from 4OVER4.COM, and our response rate jumped noticeably. The physical piece just cuts through the noise.
Verified customer, Marketing Director
For a comprehensive look at how direct mail performs across industries and formats, this hub pulls together every data point we track.
Direct mail ROI compared to digital channels
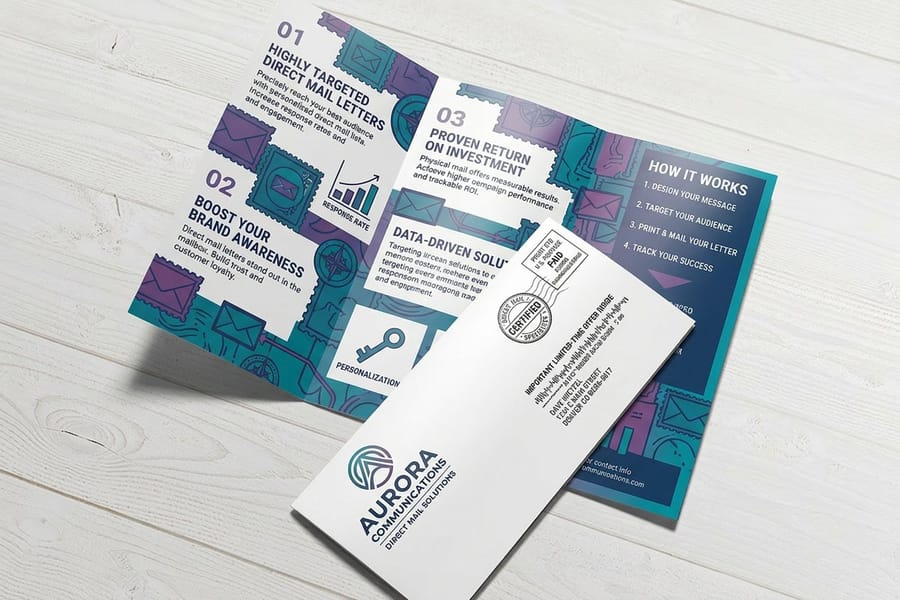
Return on investment is where direct mail advertising statistics get interesting. Physical mail costs more per piece than sending an email. That part is obvious. But the revenue per piece is also dramatically higher. When you factor in response rates, average order values, and customer lifetime value, direct mail often delivers a stronger ROI than digital-only campaigns.
The math works because people trust physical mail. They hold it. They put it on the fridge. They hand it to a spouse. Try doing that with a banner ad. Direct mail marketing statistics consistently show that recipients spend more time with a printed piece than with any digital format.
For businesses comparing channels head to head, our direct mail vs email analysis lays out the differences in engagement, cost, and conversion side by side.
Consumer trust and engagement with physical mail
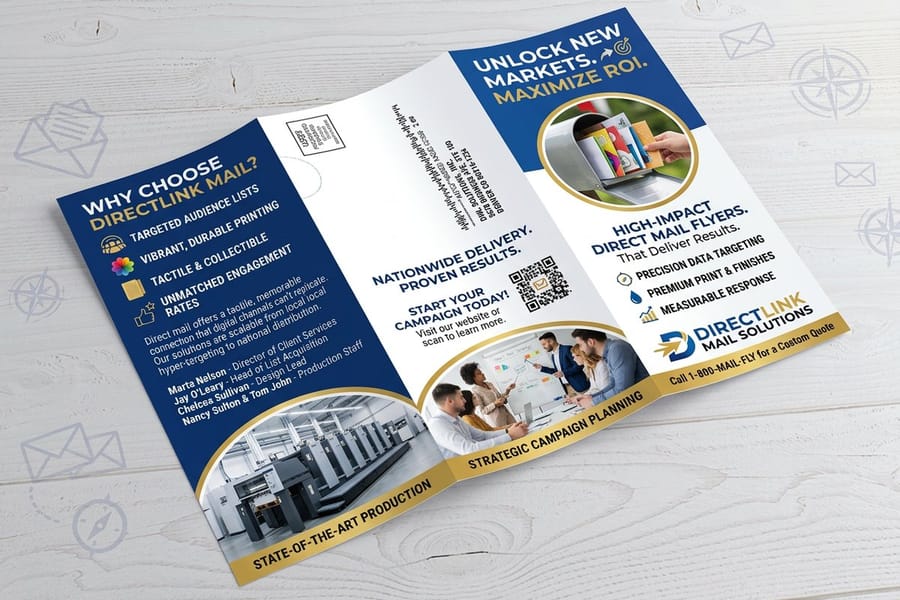
People trust mail they can touch. That is not a marketing slogan, it is a pattern that shows up across every consumer survey on the topic. Direct mail effectiveness statistics reveal that recipients find printed materials more credible than digital ads. Younger demographics, surprisingly, show strong engagement with physical mail too.
The tactile experience matters. A thick, well-printed postcard on premium stock feels different from a flimsy insert. That physical weight communicates quality before the reader even looks at your offer. It is why 4OVER4.COM offers 60 plus paper types for mailing pieces. The stock you choose sends a message all on its own.
Our clients always comment on the quality of the mailers we send. The 32pt stock from 4OVER4.COM makes our brand feel premium before they even read a word.
Verified customer, Real Estate Broker
Postal trends and B2B reach
USPS data and reaching decision-makers
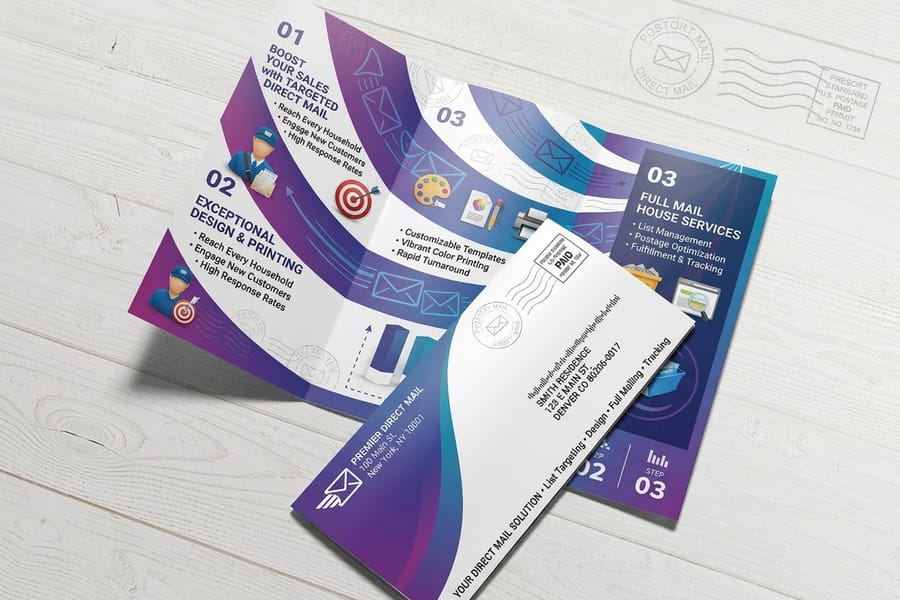
USPS direct mail statistics track volume, delivery rates, and pricing trends across the postal system. Marketing mail still represents a massive chunk of USPS revenue. The postal service has introduced programs like USPS Informed Delivery and Every Door Direct Mail that make targeting easier and more affordable for small businesses.
Postal rates do increase periodically, but the cost per impression stays competitive. When you compare the cost of reaching 1,000 people through direct mail versus paid social or display ads, mail holds its own, especially once you account for the higher attention and response rates.
B2B direct mail statistics tell a story that surprises a lot of digital-first marketers. Business buyers, the ones making purchasing decisions, respond to physical mail at rates that far exceed email. Inboxes are crowded. Desks are not. A well-designed mailer lands on a decision-maker's desk and stays there.
Account-based marketing teams have leaned heavily into direct mail for exactly this reason. When you are targeting a specific list of high-value accounts, the per-piece cost matters less than the conversion rate, and direct mail delivers conversions that justify the spend.
Dimensional mailers, meaning packages, boxes, and oversized formats, perform especially well in B2B. They get opened because they look like they contain something valuable. The curiosity factor alone drives open rates that flat mail cannot match.
Format and industry
How each format and industry performs
Not all direct mail formats perform equally, and effectiveness varies by industry, but the trend is consistent across the board: when you put a physical piece in someone's hands, they pay attention. Match the right format to the right audience and the numbers follow.
| Format | Where it wins |
|---|---|
| Postcards | Highest response rate per dollar spent, no envelope to open, instant visibility. |
| Letter packages | Strong for detailed offers, fundraising appeals, and financial services. |
| Self-mailers | Cost-effective middle ground, good for event invitations and announcements. |
| Catalogs | Highest average order value, strongest for retail and e-commerce brands. |
| Dimensional mailers | Highest open rates, best for ABM and high-value B2B targets. |
| Industry | How they use it |
|---|---|
| Real estate | Agents use Just Listed and Just Sold postcards to dominate neighborhoods. |
| Healthcare | Appointment reminders and wellness campaigns see strong engagement. |
| Financial services | Pre-approved offers and account statements drive high response. |
| Nonprofit | Fundraising appeals through mail consistently outperform digital asks. |
| Retail and e-commerce | Catalogs and promotional postcards drive both online and in-store traffic. |
Your format choice should match your goal. Driving traffic to a website calls for postcards. Closing a 50,000 dollar B2B deal calls for a dimensional mailer. Running a seasonal sale calls for catalogs or self-mailers. Each industry has its own benchmarks, but the common thread is geographic and personal relevance.
Make it relevant
Personalization and variable data in direct mail
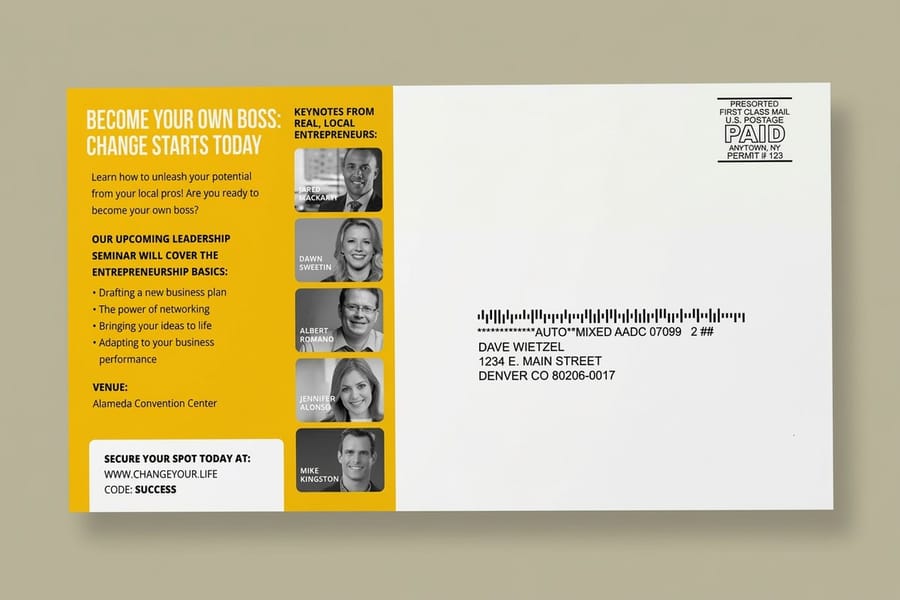
Personalized direct mail outperforms generic mail by a big margin. Variable data printing lets you customize each piece, including name, offer, image, and even the call to action, based on recipient data. Direct mail marketing statistics show that personalization lifts response rates across every format and industry.
This is not just Dear First Name anymore. Modern variable data campaigns match product recommendations to purchase history, adjust imagery by demographic, and tailor offers by geographic region. The more relevant the piece, the higher the response.
4OVER4.COM supports variable data printing across postcards, flyers, and other mailing formats. If you have the data, we have the printing technology to put it to work.
Proof, not promises
Delivery, ratings, and stock: the direct mail production record
Here are the latest figures on direct mail and postcard performance from our side of the press, the volume, spending, and quality signals that round out the picture for marketers planning campaigns in 2026 and beyond. A 99.8 percent on-time delivery rate keeps your mailing schedule on track, and a 4.9 out of 5 postcard rating across 247 verified reviews shows the print quality holds up piece after piece.
Wally turns the data into your next mailing
Statistics are only step one. The piece is step two.
The numbers all point the same way: a premium piece in someone's hands beats a message lost in their inbox. Wally's rule is simple. Pick the format that fits your offer, print it heavy on the stock that signals quality, and let the response rate do the rest. Email opens sit near 20 percent and a postcard has nothing to open at all, which is why it is the format to test against your house list before you buy a cold list.
Order postcards →Stock, finishing and price
What a postcard mailing costs, stock by stock
The table below is the live postcard price list, and the per-piece cost falls as the quantity climbs. The mailing version, Direct Mail Postcards, starts at 500 pieces for $89.68 on 14pt or 16pt cover and prints in 4 business days. Pick 16pt for a piece meant to be kept and 14pt for volume drops.
| Quantity | Price Per Unit | Total |
|---|---|---|
| 50 | 33.0¢ | $16.48 |
| 100 | 24.2¢ | $24.16 |
| 200 | 15.9¢ | $31.86 |
| 300 | 12.8¢ | $38.45 |
| 400 | 11.3¢ | $45.04 |
| 500 | 10.3¢ | $51.62 |
| 600 | 9.89¢ | $59.31 |
| 700 | 9.57¢ | $67.00 |

Start from a blank
Postcard and mailing flyer templates with the bleed already set
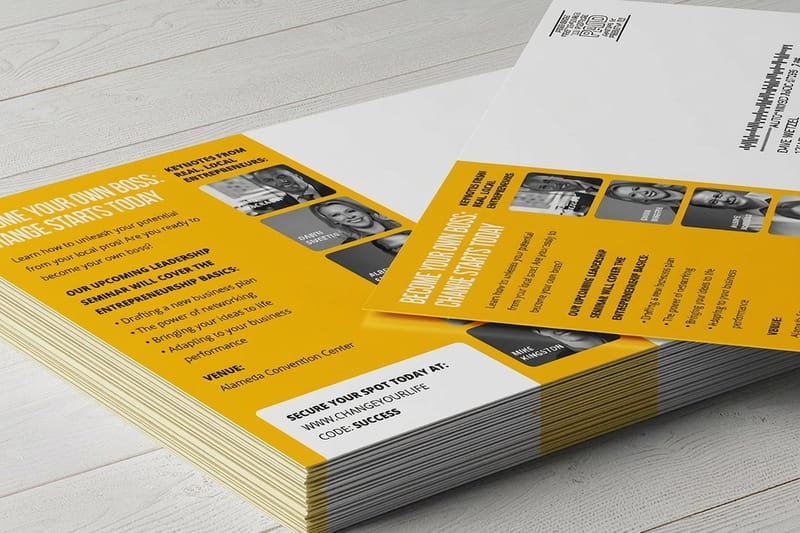
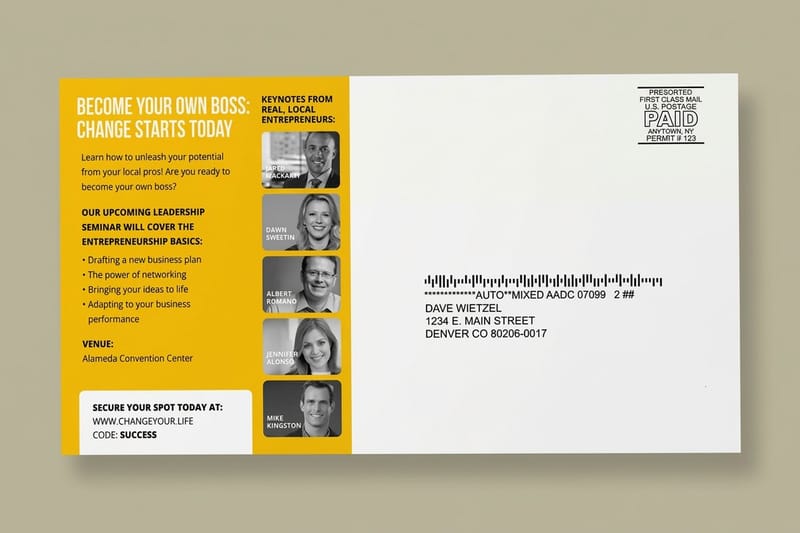
The Direct Mail Postcards and Mailing Flyers templates below carry the bleed and safe-margin lines, so the artwork trims clean and nothing important sits on the cut line.
Side by side
How direct mail stacks up against other channels
Direct mail statistics become most useful when you compare them against other channels. Marketers do not operate in a vacuum, and every dollar has to compete for the best return. The comparison below puts direct mail advertising statistics in context alongside email, paid social, and display advertising.
| Channel | Trust | Response and recall | Cost | Trackable |
|---|---|---|---|---|
| Direct mail | High, people hold it and keep it | Higher response, strong recall | Higher per piece | Yes, with codes and QR |
| Lower, easy to ignore | Around 20 percent open, low recall | Very low per send | Yes | |
| Paid social | Lower, scrolled past | Low intent, short attention | Low cost per impression | Yes |
| Display ads | Lowest, banner blindness | Low click-through | Low cost per impression | Yes |
Physical mail wins on trust, response rate, and memorability. Digital wins on speed and cost per impression. The smartest marketers do not pick one or the other, they use both. A postcard that drives someone to a landing page combines the strengths of both channels.
For B2B direct mail statistics specifically, the gap widens even further. Decision-makers are harder to reach through digital channels because of spam filters, ad blockers, and inbox fatigue. Physical mail bypasses all of that.
If you want to make your next mailer impossible to ignore, consider formats like 3D postcards that add a visual wow factor right in the mailbox. Dimensional and specialty formats consistently outperform standard flat mail in both open rates and response rates.
4OVER4.COM has printed over 10 billion cards and mailers, and the feedback is consistent. Quality print on premium stock gets better results than cheap, flimsy alternatives. The medium is part of the message.
Myths vs facts
Four direct mail myths the response data does not support
A few myths keep marketers from running mail that would pay off. The pairs below set each common assumption against what the direct mail statistics actually show, so you can plan your next campaign on evidence rather than habit.
Email always beats direct mail on results.
Email is cheaper per send, but direct mail generates more revenue per piece with higher response and better brand recall.
Direct mail cannot be measured the way digital can.
Track response rate, cost per acquisition, and ROI, then add QR codes or unique offers per batch for hard, batch-level numbers.
Direct mail is too expensive for small businesses.
USPS Every Door Direct Mail reaches whole neighborhoods without a list, and concentrated local audiences often see the strongest response.
Younger buyers ignore physical mail.
Younger demographics show strong engagement with physical mail too, and recipients find printed pieces more credible than digital ads.
Print it
Six mailing pieces, from 14pt postcards to lenticular cards
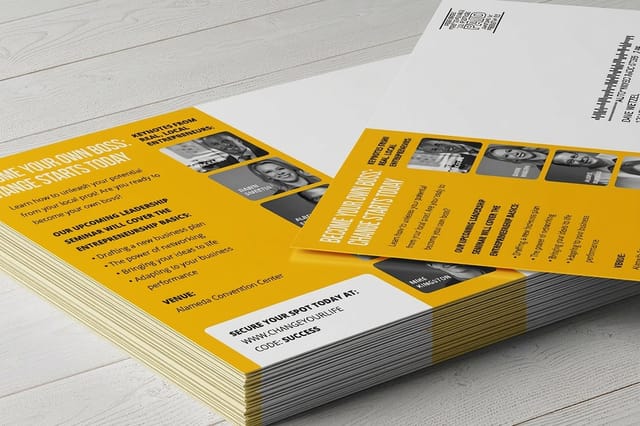
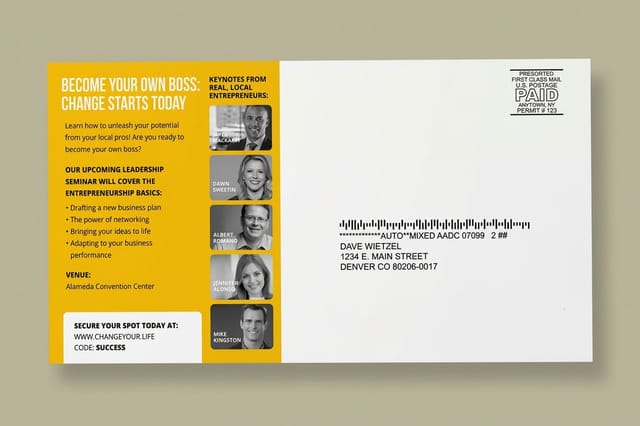
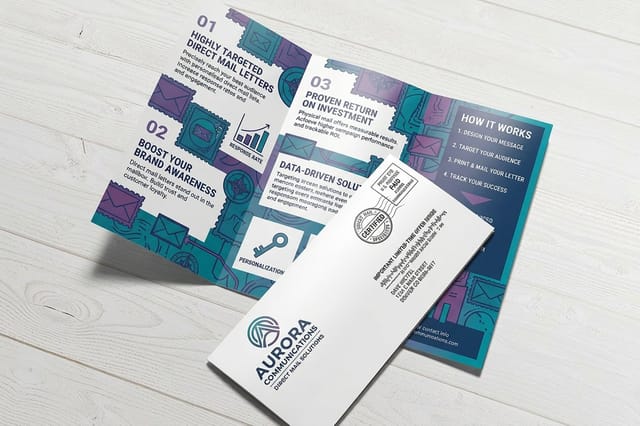
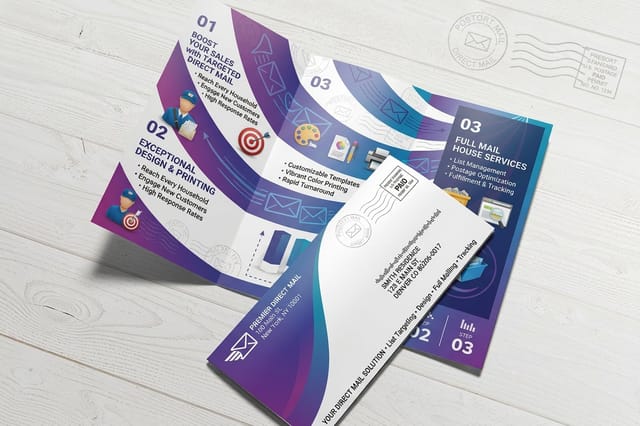
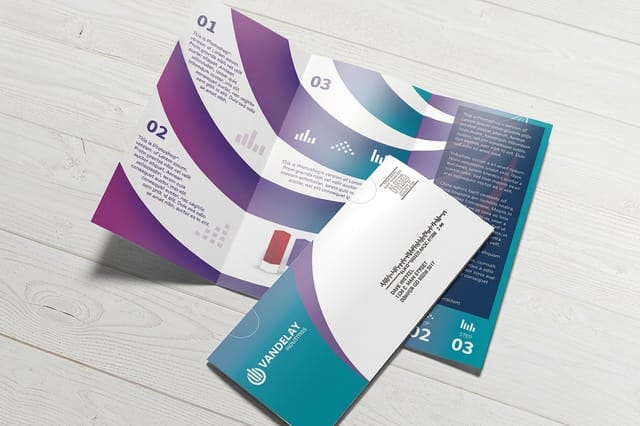
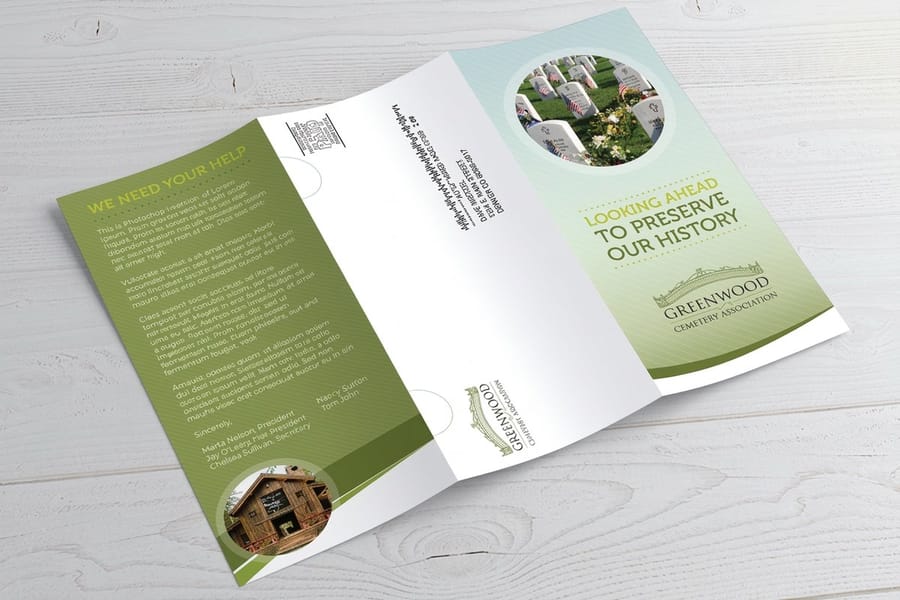
Direct Mail Postcards start at 500 pieces for $89.68 on 14pt or 16pt cover and print in 4 business days. Direct Mail Letters, Flyers, and Brochures start at 500 for $238.73 on 100# text stocks and print in 6. These are the pieces marketers order when they put the benchmarks above to work.

What our print data reveals
What 150,000 businesses ordering mailers reveal about direct mail
Direct mail statistics from third-party sources are valuable. But 4OVER4.COM's own data, drawn from 150,000 plus businesses ordering print, adds another layer of insight. With 10,000 plus reviews and a 4.8 out of 5 star average rating, we see patterns that industry reports do not always capture.
Postcard orders make up a big portion of our mailing-related volume. Businesses that reorder direct mail pieces tend to increase their quantities over time, a strong signal that campaigns are working. The shift toward thicker stocks, meaning 16pt and above, suggests marketers are investing in quality over quantity.
B2B direct mail statistics from our order data show that business-to-business buyers gravitate toward premium finishes like Soft Touch and Spot UV. They want their mail to feel different from everything else in the stack. That tactile differentiation drives the response rates the industry data promises.
The gap between reading a benchmark and hitting it is the piece itself. 4OVER4.COM bridges that gap with 1,000 plus products, 60 plus paper types, and a 99.8 percent on-time delivery rate that keeps your mailing schedule on track.
Your mailer's stock, finish, and print quality directly affect whether recipients engage or toss it. A postcard on 32pt Ultra Thick stock with Soft Touch lamination does not just get read, it gets kept. That is the difference between hitting industry-average response rates and beating them.
The quality of 4OVER4.COM's postcards made our direct mail campaign feel like a premium brand experience. Response rates were the best we have seen in three years of mailing.
Verified customer, E-commerce Manager
Why marketers trust us
The direct mail print record behind these benchmarks
The figures above come from a press that has run direct mail since 1999. A 4.8 out of 5 average across 10,000 plus reviews and 150,000 plus businesses served are the record behind the benchmarks, and Direct Mail Postcards print in 4 business days, so the mail date you plan around holds.
How we built this
Where each direct mail statistic on this page comes from
Every direct mail statistic on this page comes from published industry research, USPS reporting, or 4OVER4.COM's internal order and review data, drawn from 10,000 plus reviews and 150,000 plus businesses served. We cross-reference multiple sources before including any data point. Numbers are updated as new research becomes available to keep B2B direct mail statistics and consumer-facing benchmarks current and reliable.

Get Started
Start with Direct Mail Postcards: 500 for $89.68, printed in 4 business days
Direct Mail Postcards run on 14pt or 16pt cover; letters, flyers, and brochures run on 100# text and print in 6 business days.
Legal Disclaimer
Gold Standard guarantees apply to all standard orders placed through 4over4.com. Price match requires verifiable proof of a competitor's published price for an equivalent product with matching specifications and turnaround time. Satisfaction guarantee covers manufacturing defects and print quality issues. Contact support with order number and documentation. On-time delivery rate based on tracked orders 1999 to 2026. Individual results may vary based on shipping carrier performance.
Explore more
Direct mail products, guides, reviews, and a price comparison
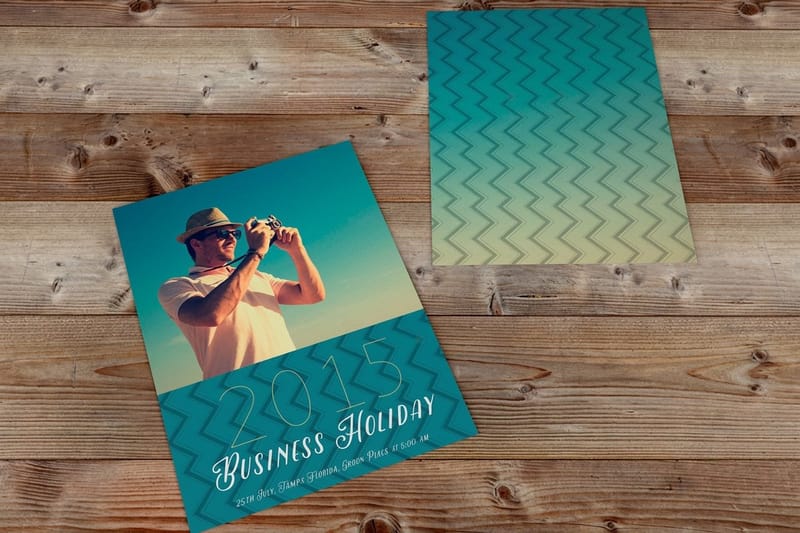 Product Postcards Print the direct mail format with the highest response per dollar.
  Guide How to Make Postcards Design, print, and mail a postcard campaign step by step.
 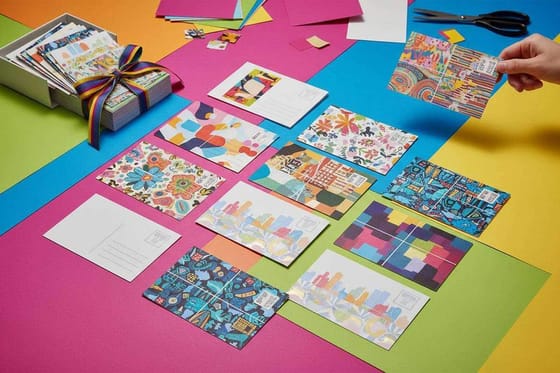 Showcase Postcard Showcase Real customer postcards across stocks, finishes, and sizes.
  Statistics Direct Mail Effectiveness The engagement and recall research behind the numbers.
  Alternative 4OVER4 vs PostcardMania How our postcard pricing and stock options compare.
  Location Postcards in New York Local postcard printing and mailing for NYC businesses.
  Case study Nonprofit Mail Case Study How a nonprofit doubled donations with direct mail.
  Reviews Postcard Reviews What 150,000 plus businesses say about our postcards.
  Benefit Bulk Discounts Per-piece price drops fast as your mailing quantity climbs.
  FAQs Printing FAQs Answers on stock, sizes, proofs, and mailing turnaround.
 Questions and answers
Common questions about direct mail data and performance
Response rates, ROI, B2B reach, formats, and samples, answered.
What are the most important direct mail statistics for planning a campaign?
The numbers that matter most are response rate, cost per acquisition, and return on investment. House lists almost always outperform prospect lists by a wide margin, so weigh that gap when you forecast. Pair these figures with your average customer lifetime value to decide whether mail makes financial sense for your business, then check our Showcase for examples of high-performing mailer designs.
How do direct mail effectiveness statistics compare to email marketing?
Direct mail effectiveness statistics consistently show higher response rates and better brand recall than email. Email is cheaper per send, but direct mail generates more revenue per piece. The strongest campaigns combine both, a physical mailer followed by an email sequence, and that multi-touch approach lifts overall conversion beyond what either channel reaches alone.
Are direct mail advertising statistics still relevant for small businesses?
Yes, they apply to businesses of every size. Programs like USPS Every Door Direct Mail make it affordable to reach entire neighborhoods without buying a mailing list. Small businesses such as restaurants, salons, and contractors often see the strongest local response because their audience is geographically concentrated.
What do B2B direct mail statistics say about reaching corporate buyers?
B2B direct mail statistics show that physical mail reaches decision-makers more reliably than email, which often gets caught in spam filters or ignored in crowded inboxes. Dimensional mailers and premium-stock postcards perform especially well for account-based marketing. Visit our Help Center for guidance on setting up a B2B mailing campaign.
What direct mail format has the highest response rate?
Direct mail marketing statistics point to oversized postcards and dimensional mailers for the highest response rates. Postcards win on cost-efficiency because there is no envelope to open, so your message is visible right away. Dimensional mailers win on sheer open rates because a box gets opened where a flat card does not. Your choice depends on budget and audience.
How can I request free print samples before committing to a direct mail campaign?
Order Free Samples from 4OVER4.COM to feel the paper stocks, see the print quality, and compare finishes before placing a full order. Touching the actual product helps you pick the right stock for your campaign, and that choice directly affects the response rates these direct mail statistics promise.
