
Direct Mail Effectiveness Statistics for 2026


Response rates, open rates, ROI, and tracking methods, set against the order data behind 25 plus years of printing direct mail at 4OVER4.
Direct mail effectiveness is measurable, not nostalgic. House lists respond near 9 percent against email under 1 percent, physical mail reaches a roughly 90 percent open rate, and brand recall runs about 75 percent higher than digital. With 150,000 plus businesses printing with 4OVER4.COM and 10 billion plus cards produced, the data backs up what marketers already feel.
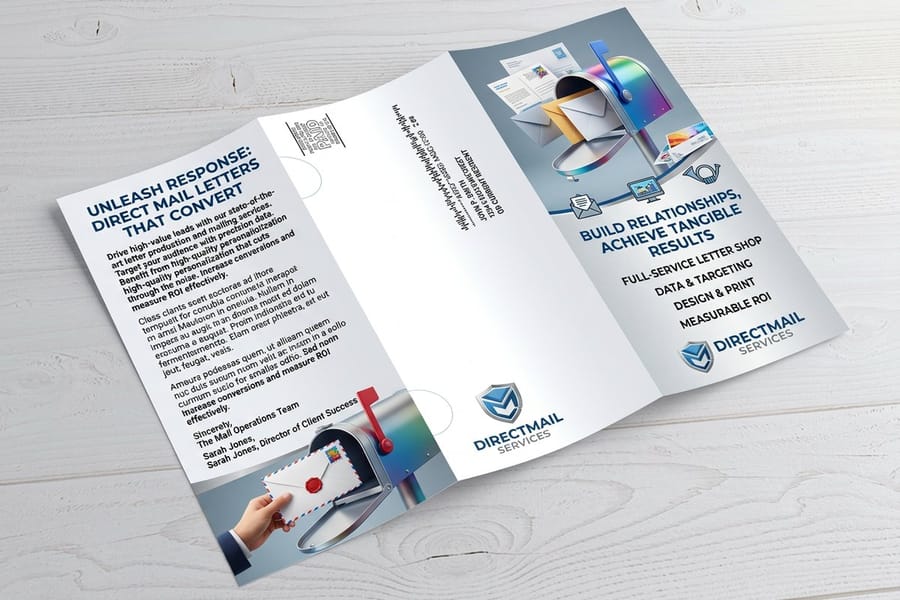
What the data shows
What the direct mail effectiveness data tells us
Direct mail effectiveness is not a matter of opinion, it is a matter of measurement. House-list response rates land near 9 percent while email response sits under 1 percent, physical mail reaches a roughly 90 percent open rate, and brand recall runs about 75 percent higher than digital. With 150,000 plus businesses trusting 4OVER4.COM for their print campaigns, the numbers back up what marketers already feel. For acquisition campaigns and for retention plays, the data below shows exactly where mail earns its place, and how to track every dollar of it.
Why it works
Why direct mail effectiveness still delivers real results
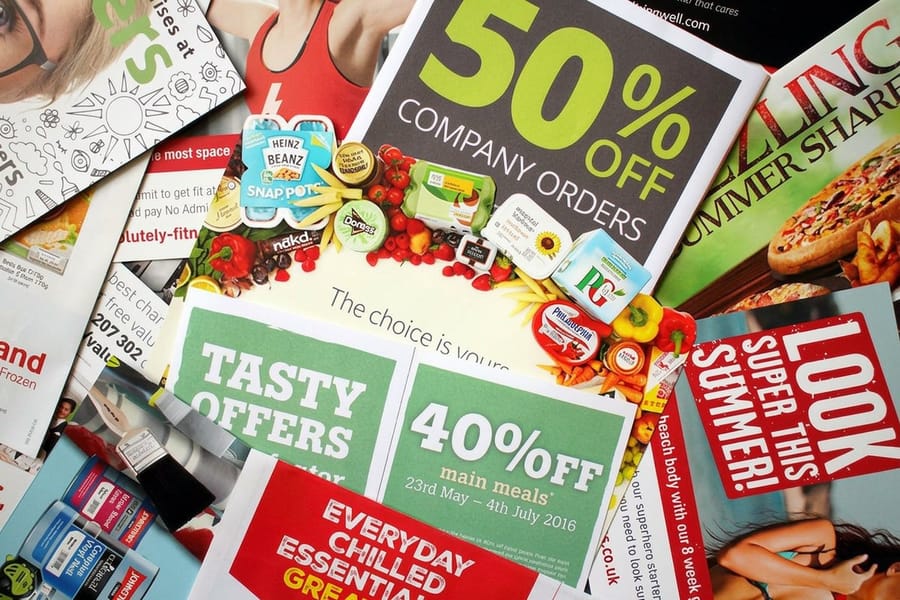
Direct mail effectiveness is not a relic of the past. It is a measurable, high-performing channel that keeps outpacing digital alternatives on the metrics that matter most, response rates, brand recall, and customer trust. Physical mail gets opened, read, and acted on at rates that would make most email campaigns jealous.
4OVER4.COM has printed more than 10 billion cards and mailers for over 150,000 businesses, which gives us a front-row seat to what works. Tracking direct mail effectiveness starts with understanding the data behind it, and this page breaks down the numbers, benchmarks, and strategies that matter. For the wider view, explore our full direct mail statistics hub.
The numbers
The data behind direct mail marketing effectiveness
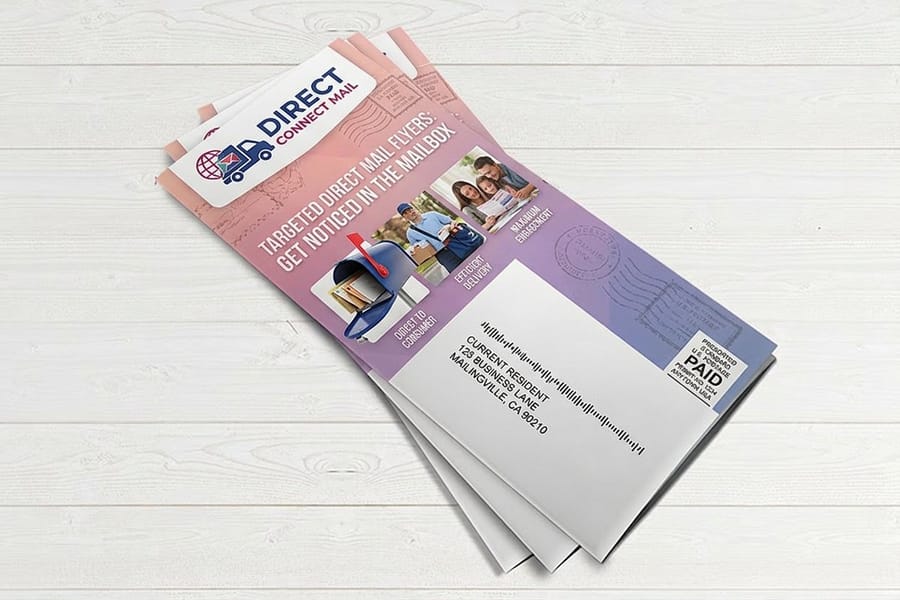
Direct mail effectiveness is backed by hard numbers, not nostalgia. According to the Association of National Advertisers, direct mail response rates for house lists average around 9 percent, while prospect lists sit near 5 percent. Compare that to email response rates under 1 percent and the gap becomes obvious.
For a deeper look at industry-wide benchmarks, see our average direct mail response rate breakdown. If you are focused on the financial side, our direct mail ROI calculator helps you project returns before you spend a dollar.
4OVER4.COM has been in the printing business for more than 25 years, shipping direct mail pieces with a 99.8 percent on-time delivery rate. That reliability matters when your campaign hinges on timing, and below you will find the research and product visuals that put these numbers into context.

Mail vs email
Direct mail versus email, a side by side look
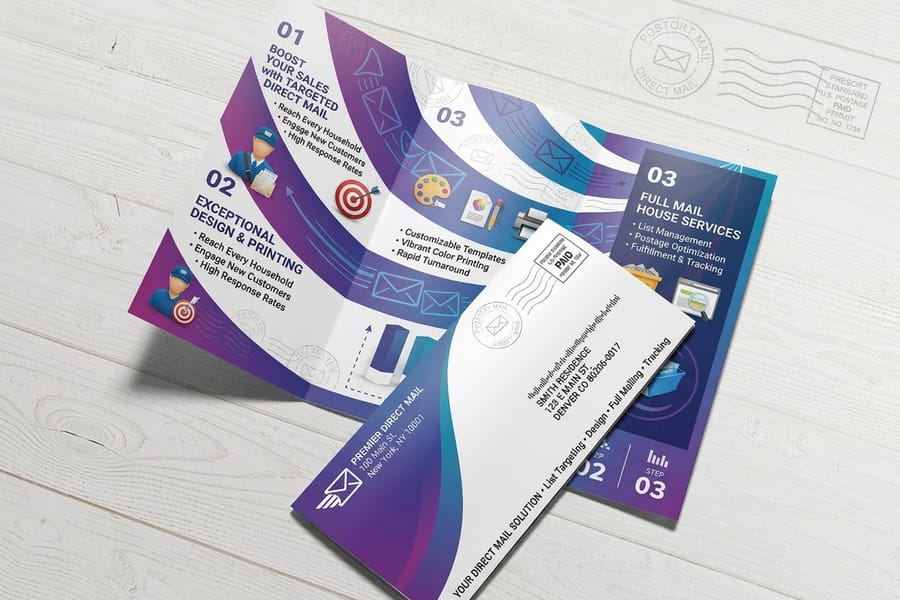
The direct mail vs email question is not really a debate anymore. Both channels have their place, but the numbers favor mail when it comes to engagement depth. According to USPS data, direct mail reaches roughly a 90 percent open rate, while email open rates average 20 to 25 percent on a good day.
Brand recall after seeing a physical ad runs about 75 percent higher than after a digital ad. Direct mail also has staying power. A postcard might sit on someone's fridge for weeks, while an email is deleted in seconds if it is opened at all. That extended exposure means more impressions per piece and higher conversion over time.
The smartest marketers do not pick one channel over the other. They use direct mail to drive traffic to digital touchpoints, creating a multi-channel loop that compounds results. For brands that want to stop people mid-sort, 3D postcards add a visual wow factor right in the mailbox.
Who responds
Who opens direct mail, audience engagement by demographic
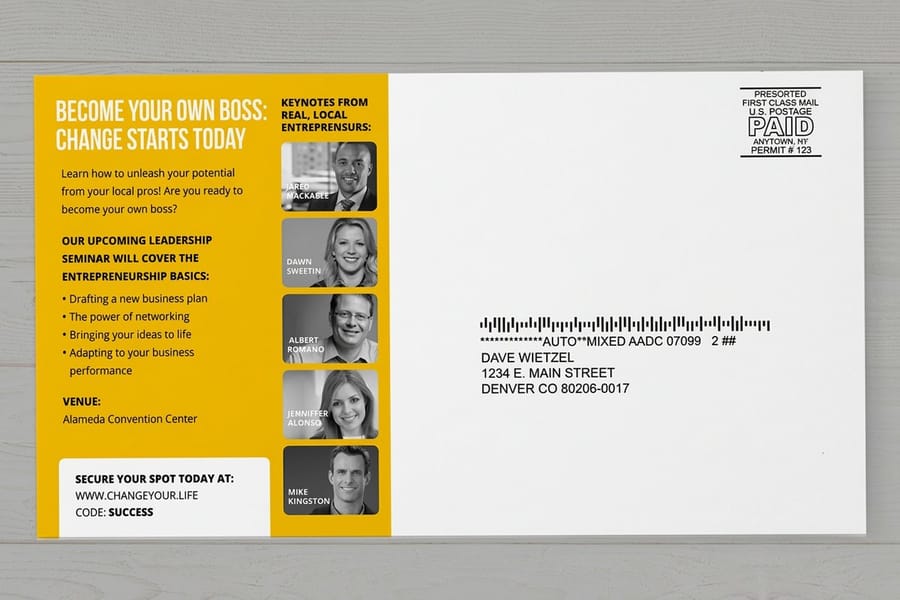
One common misconception is that only older demographics respond to physical mail. The data says otherwise. According to USPS research, 87 percent of millennials say they enjoy receiving direct mail, and Gen Z finds physical mail novel and personal after growing up in a digital-saturated world.
Baby boomers remain the most responsive demographic, with response rates that can exceed 10 percent for well-targeted offers. The cross-generational appeal means your campaigns are not limited to a single age group.
B2B mailers perform well too. Decision-makers receive hundreds of emails a day but only a handful of physical pieces, so a well-designed mailer stands out on an executive's desk in a way another message in the inbox never will.
Our print data
What 4OVER4 print data reveals about mail campaigns
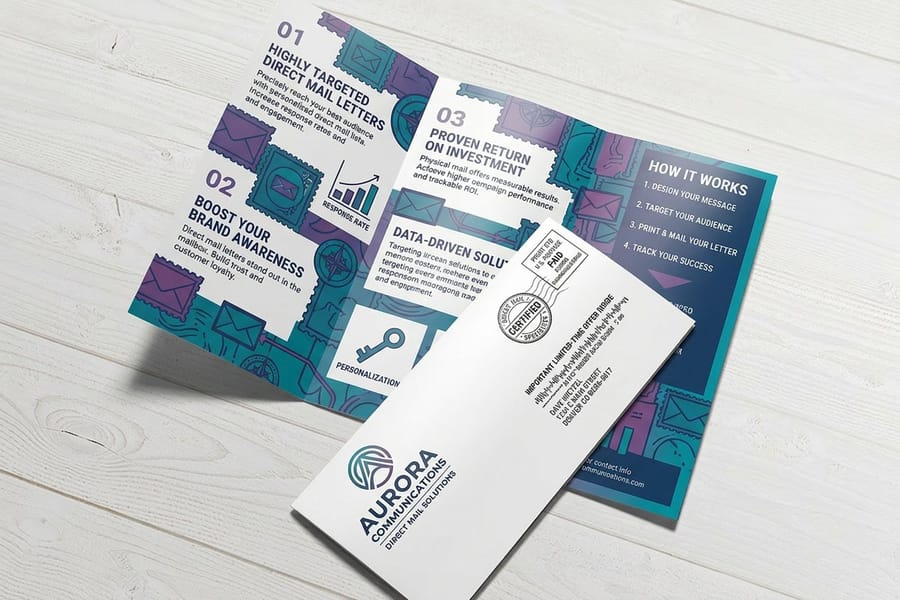
With more than 10 billion cards and mailers printed over 25-plus years, 4OVER4.COM has a unique perspective on direct mail effectiveness. Our production data shows clear patterns in what high-performing campaigns share. Thicker stocks get better results, and customers who order postcards on 16pt or 32pt cardstock report stronger response than those on standard 14pt.
Finish choice matters too. Soft Touch matte and Spot UV coatings create a tactile experience that makes recipients pause, and that pause is where conversion starts. Our 10,000-plus reviews with a 4.8 out of 5 star average confirm what the data suggests, print quality directly affects direct mail marketing effectiveness.
For a postcard run on a real estate farming campaign or premium invitations for a nonprofit event, the quality of the printed piece shapes how recipients perceive your brand before they read a single word.
By the numbers
The open, response, and recall figures that define effectiveness
Here are the headline figures marketers reach for first when they weigh a mailing, drawn from published industry research and our own production data. House lists outperform prospect lists, mail beats email on open rate and recall, and premium stock lifts the response the benchmarks promise. Set those figures against 25 plus years of printing direct mail at 4OVER4.COM and the pattern is consistent.
Format and industry
How each format and industry performs
Not all direct mail formats perform equally, and effectiveness varies by industry, but the trend is consistent: when you put a physical piece in someone's hands, they pay attention. Match the right format to the right audience and the response follows.
| Format | Where it wins |
|---|---|
| Postcards | Highest open rate with no envelope to open, lowest cost per piece, best for simple offers and brand awareness. |
| Letters in envelopes | Higher perceived value, better for complex offers, personalized messaging, and B2B outreach. |
| Catalogs | Longest shelf life, kept for around 20 days on average, best for retail and product-heavy brands. |
| Dimensional mailers | Highest response rates, up to 8.5 percent for prospect lists, at the highest cost per piece. |
| Self-mailers | Folded pieces with no envelope, a cost-effective middle ground with decent engagement. |
| Industry | How they use it |
|---|---|
| Real estate | Just Sold and Just Listed postcards see 3 to 5 percent response, and neighborhood farming builds long-term pipelines. |
| Healthcare | Appointment reminders by mail cut no-show rates by up to 30 percent, and acquisition mailers perform in competitive markets. |
| Financial services | Pre-approved offer letters remain one of the highest-performing formats, often above 5 percent response. |
| Nonprofits | Donation request letters drive the majority of individual giving, and personalized asks outperform generic appeals. |
| Retail and e-commerce | Catalogs and promotional postcards drive both online and in-store traffic. |
Your format choice should match your goal. Brand awareness calls for postcards, a detailed B2B offer calls for a dimensional mailer, and a product showcase calls for a catalog. Each industry has its own benchmarks, but the common thread is geographic and personal relevance.
Prove what works
How to measure direct mail effectiveness
Tracking direct mail effectiveness requires intentional setup before your campaign drops. The methods below capture different types of conversion, and combining two or three gives you the clearest read on true performance.
| Method | What it captures |
|---|---|
| Unique promo codes | A code exclusive to your mailer tells you exactly where a redemption came from, online or in store. |
| Dedicated landing pages | A URL that appears only on your piece lets you track visits, form fills, and conversions from that page. |
| QR codes | Quick to scan and easy to track, capturing device, location, and time of scan. |
| Call tracking numbers | A unique phone number on your mailer turns every call into an attributable direct mail lead. |
| Matchback analysis | Compare your mailing list against new orders within a set window to catch conversions that skipped a code or URL. |
Side by side
How direct mail stacks up against other channels
Direct mail effectiveness data is most useful when you compare it against other channels, because every dollar competes for the best return. The comparison below puts direct mail alongside email, paid social, and display advertising so you can see where each one earns its budget.
| Channel | Trust | Response and recall | Cost | Trackable |
|---|---|---|---|---|
| Direct mail | High, people hold it and keep it | Around 90 percent open, strong recall | Higher per piece | Yes, with codes and QR |
| Lower, easy to ignore | Around 20 percent open, low recall | Very low per send | Yes | |
| Paid social | Lower, scrolled past | Low intent, short attention | Low cost per impression | Yes |
| Display ads | Lowest, banner blindness | Low click-through | Low cost per impression | Yes |
Physical mail wins on trust, response rate, and memorability. Digital wins on speed and cost per impression. The smartest marketers do not pick one or the other, they use both. A postcard that drives someone to a landing page combines the strengths of each channel.
When you compare direct mail effectiveness against digital, use the same attribution window, the same conversion definition, and the same audience segment. Mail often has a longer conversion cycle, so measuring only the first 48 hours undercounts. Multi-channel campaigns of mail plus email or mail plus retargeting outperform single-channel efforts by 20 to 40 percent.
Myths vs facts
Four effectiveness claims the mail data does not support
A few myths keep marketers from running mail that would pay off. The pairs below set each common assumption against what the direct mail effectiveness data actually shows, so you can plan your next campaign on evidence rather than habit.
Direct mail effectiveness has faded in the digital age.
Response rates for house lists average around 9 percent, far above email under 1 percent, and physical mail earns more attention and recall than any digital format.
Direct mail cannot be tracked the way digital can.
Use promo codes, dedicated landing pages, QR codes, call tracking numbers, or matchback analysis to attribute conversions with precision.
Only older demographics respond to physical mail.
USPS research shows 87 percent of millennials enjoy receiving mail, and Gen Z finds printed pieces novel and personal in a digital-first world.
All direct mail formats perform about the same.
Postcards win on cost per response, dimensional mailers earn the highest open rates, and catalogs hold the longest shelf life.
Wally turns the effectiveness data into your next mailing
Statistics are only step one. The piece is step two.
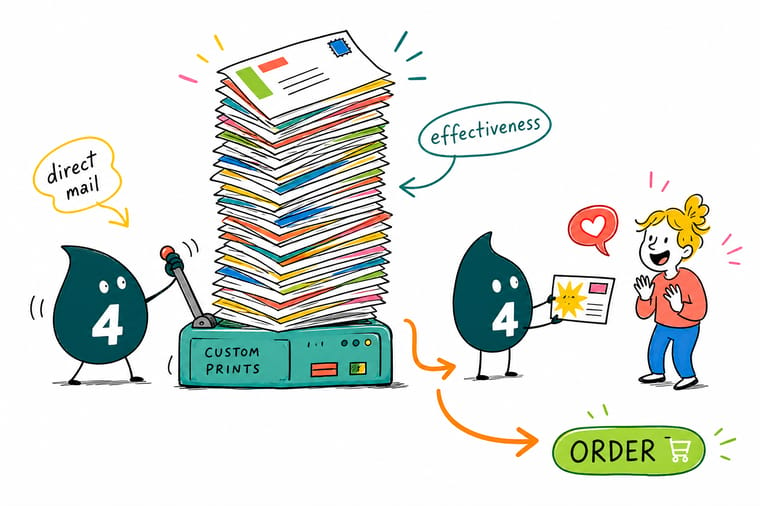
Effectiveness here is measured rather than asserted: open rate, response rate, recall. Wally's rule is simple. Pick the format that fits your offer, print it heavy on the stock that signals quality, track it before it drops, and let the response rate do the rest. A 500 piece postcard run costs $89.68 on 14pt or 16pt cover and prints in 4 business days.
Order postcards →Proof, not promises
What our own mail production shows on time and stock
Here are the quality and reliability signals from our side of the press, the figures that round out the effectiveness picture for marketers planning campaigns in 2026 and beyond. A 99.8 percent on-time delivery rate keeps your mailing schedule on track, and a 4.8 out of 5 average across 10,000 plus reviews shows the print quality holds up piece after piece.
Stock, finishing and price
Postcard costs and the stocks that carry a mailing
A 500 piece postcard run costs $89.68 on 14pt or 16pt cover and prints in 4 business days. The table lists every stock and finish, so the piece can be matched to the offer before the list is bought.
| Quantity | Price Per Unit | Total |
|---|---|---|
| 50 | 33.0¢ | $16.48 |
| 100 | 24.2¢ | $24.16 |
| 200 | 15.9¢ | $31.86 |
| 300 | 12.8¢ | $38.45 |
| 400 | 11.3¢ | $45.04 |
| 500 | 10.3¢ | $51.62 |
| 600 | 9.89¢ | $59.31 |
| 700 | 9.57¢ | $67.00 |

Start from a blank
Mailing templates cut to size before you design
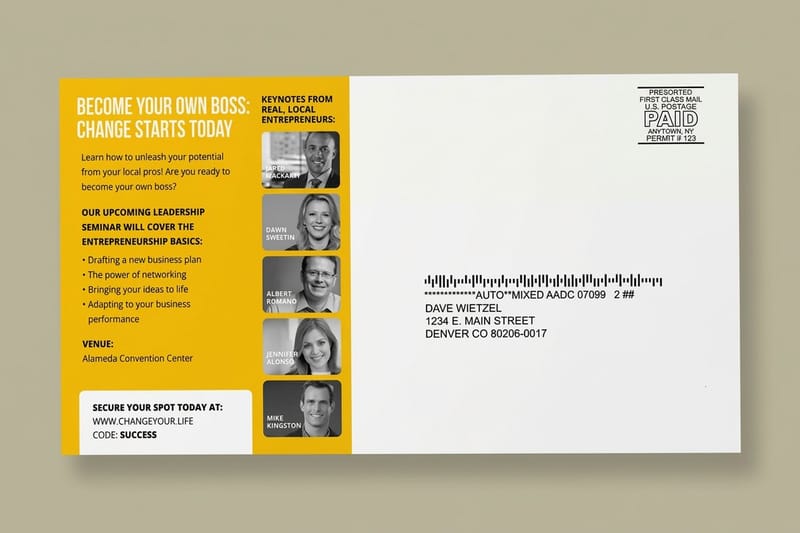
Every template below is drawn to the finished trim with the bleed and safe margins already marked, so the artwork does not shift when the piece is cut.
Print it
The mail pieces these effectiveness figures describe
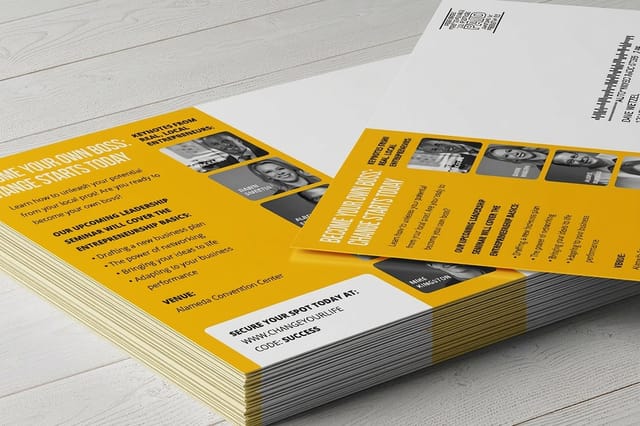
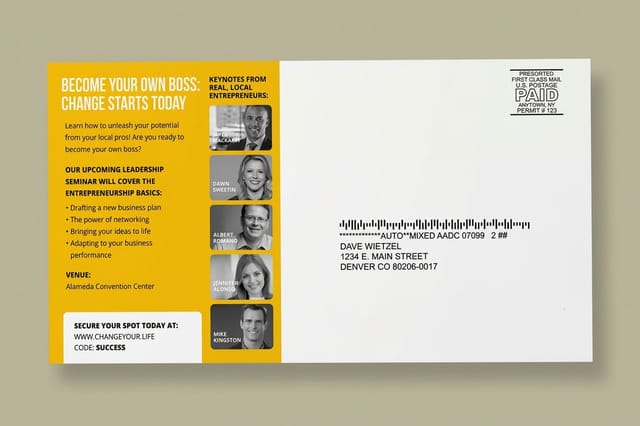
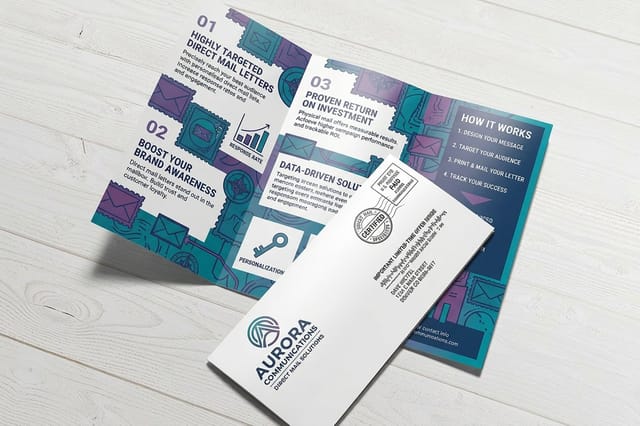
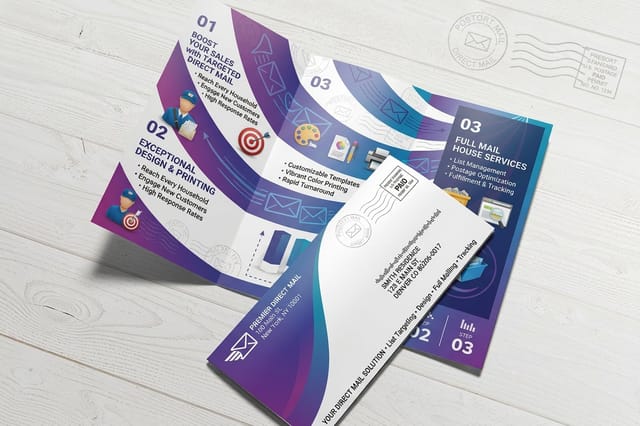
Postcards carry the lowest entry cost at 500 for $89.68 on 14pt or 16pt cover. Letters, flyers, and brochures run 500 for $238.73 on 100# text and take 6 business days. These are the pieces marketers order when they act on the numbers above.

Why marketers trust us
The production record behind these effectiveness numbers
Effectiveness data is worth little if the mail misses its drop date. A 4.8 out of 5 average across 10,000 plus reviews and 150,000 plus businesses served stand behind these runs, and a postcard mailing prints in 4 business days while letters and brochures take 6.
How we built this
The sources behind each effectiveness figure here
The direct mail effectiveness statistics on this page come from published research by the Association of National Advertisers, the Data and Marketing Association, USPS studies, and 4OVER4.COM's internal production and customer data spanning 25 plus years and 10 billion plus printed pieces. We cross-reference multiple sources before including any figure, and all data points reflect the most recently available reporting periods.

Get Started
Print 500 postcards for $89.68 and measure it yourself
Postcards print in 4 business days on 14pt or 16pt cover. Letters, flyers, and brochures print in 6 on 100# text from $238.73 for 500.
Legal Disclaimer
Gold Standard guarantees apply to all standard orders placed through 4over4.com. Price match requires verifiable proof of a competitor's published price for an equivalent product with matching specifications and turnaround time. Satisfaction guarantee covers manufacturing defects and print quality issues. Contact support with order number and documentation. On-time delivery rate based on tracked orders 1999 to 2026. Individual results may vary based on shipping carrier performance.
Explore more
Effectiveness research, mailing formats, and postcard reviews
 Statistics Direct Mail Statistics Response rates, ROI, and format data across the silo.
  Statistics Direct Mail ROI Project returns before you spend a dollar on a mailing.
  Statistics Response Rate Benchmarks What a strong direct mail response rate looks like.
 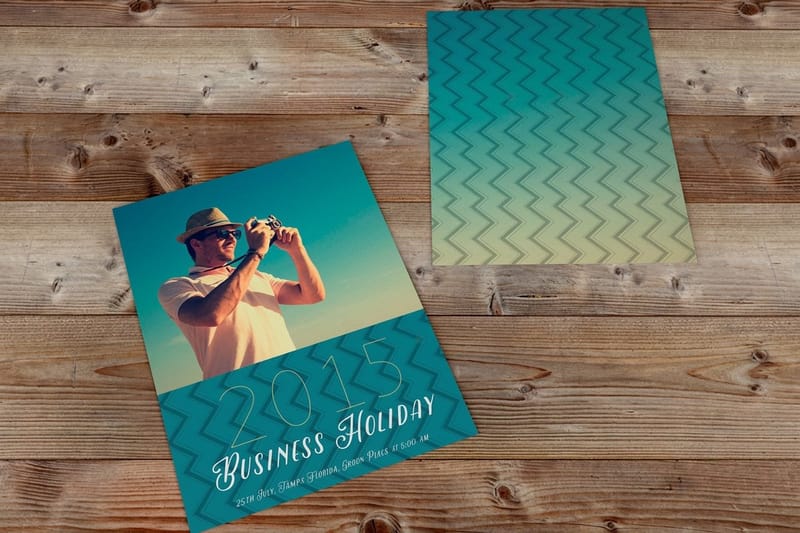 Product Postcards The direct mail format with the highest response per dollar.
 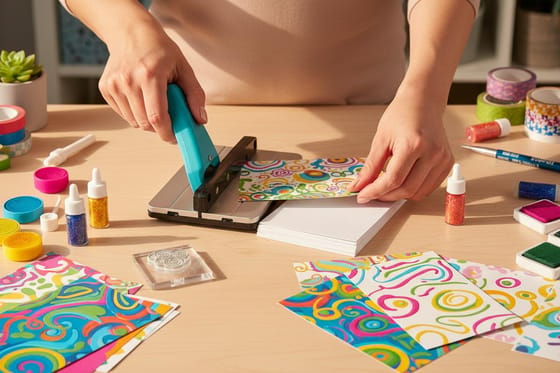 Guide How to Make Postcards Design, print, and mail a postcard campaign step by step.
 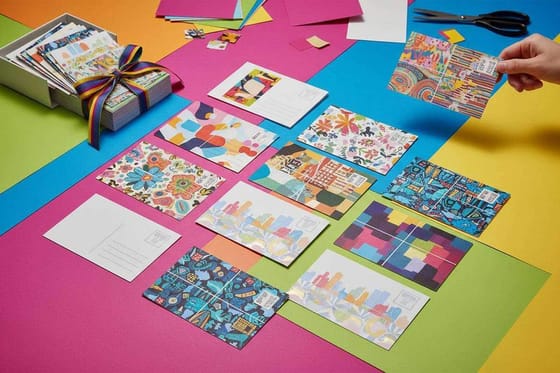 Showcase Postcard Showcase Real customer postcards across stocks, finishes, and sizes.
  Alternative 4OVER4 vs PostcardMania How our postcard pricing and stock options compare.
  Case study Nonprofit Mail Case Study How a nonprofit doubled donations with direct mail.
 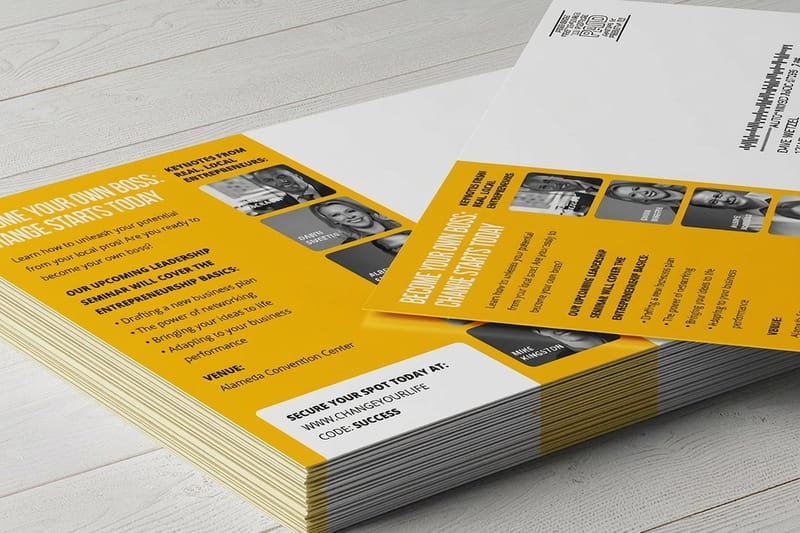 Templates Postcard Templates Print-ready blanks with bleed and safe margins built in. FAQs Printing FAQs Answers on stock, sizes, proofs, and mailing turnaround.
 Questions and answers
Common questions about direct mail effectiveness
Response rates, email comparisons, tracking, formats, and samples, answered.
What is a good response rate for direct mail?
A good response rate depends on your list type. House lists of existing customers typically see 5 to 9 percent, while prospect lists average 2 to 5 percent. These numbers vary by industry, offer strength, and print quality. Direct mail effectiveness statistics consistently show that personalized, well-designed pieces on premium stock outperform generic mailers by a wide margin.
How does direct mail compare to email marketing?
Direct mail has a roughly 90 percent open rate compared to email at 20 to 25 percent, and response rates for mail run 5 to 9 times higher. Brand recall is about 75 percent stronger with physical pieces. Direct mail marketing effectiveness shines in engagement depth, while email excels at speed and low cost per send, so the best campaigns use both.
What is the best way to track direct mail campaign results?
Tracking direct mail effectiveness requires planning before you print. Use unique promo codes, dedicated landing pages, QR codes, call tracking numbers, or matchback analysis. Each method captures a different type of conversion, and combining two or three gives you the most accurate picture of true performance.
Does paper quality actually affect direct mail response rates?
Yes. Thicker, higher-quality stocks create a tactile impression that signals credibility. A 32pt postcard feels solid, so recipients are more likely to read it and keep it. Finishes like Soft Touch matte or Spot UV add a sensory element that increases engagement. Order free samples to feel the stocks before you commit.
Which direct mail format gets the best results?
Postcards deliver the highest open rate with no envelope to open, at the lowest cost per piece. Letters work better for complex or personalized offers, and dimensional mailers get the highest response rates overall but cost more. Your format should match your goal and budget. Browse our Showcase for real examples of high-performing designs.
How many times should I mail the same audience?
Three-touch campaigns of three mailings to the same list over 6 to 8 weeks consistently outperform single sends. The first mailing builds awareness, the second creates familiarity, and the third drives action. Response rates can more than triple with a multi-touch approach compared to a one-time drop.
Is direct mail effective for younger audiences?
Absolutely. According to USPS research, 87 percent of millennials enjoy receiving physical mail, and Gen Z finds direct mail novel in a digital-first world. Younger demographics respond well to creative formats, bold design, and interactive elements like QR codes that bridge physical and digital experiences.
