
Average Direct Mail Response Rate Benchmarks & Data


Response rates by format, industry, and list type, set against the order data behind 25 plus years of printing direct mail at 4OVER4.
The average direct mail response rate sits between 2.7 and 4.4 percent, higher than most digital channels. House lists clear 5 to 9 percent, prospect lists land 2 to 5 percent, and postcards post the highest response per dollar. With 150,000 plus businesses printing with 4OVER4.COM and 10 billion plus cards produced, the benchmarks below show what good looks like and how to beat it.
Summary
What the response rate data tells us
The average direct mail response rate sits between 2.7 and 4.4 percent depending on the audience, according to the Data and Marketing Association, and that is dramatically higher than most digital channels. House lists, your existing customers, pull stronger numbers than prospect lists every time. 4OVER4.COM has printed 10 billion plus cards for 150,000 plus businesses, and clients consistently report that print quality shapes how recipients respond. Check our daily deals to start with high-impact mailers at a better price.
By the numbers
The response rates a mailing forecast should start from
Here are the headline figures marketers reach for first when they forecast a mailing, drawn from industry benchmarks and our own production data. Response rate is the metric that anchors budget, cost per acquisition, and campaign goals, so start here and match the right number to your list type before you commit a single dollar to postage.

Why it still matters
Why direct mail response rates still matter in 2026
The average direct mail response rate remains one of the strongest performance metrics in marketing. While email open rates hover around 20 percent and click-through rates sit below 3 percent, physical mail consistently generates measurable, trackable responses that justify the investment. For the broader picture, explore our direct mail statistics hub.
Direct mail is not just surviving, it is outperforming. According to the Association of National Advertisers, response rates for house lists average around 9 percent, while prospect lists average around 4.9 percent. Those numbers beat most digital benchmarks, and the average response rate for direct mail postcards is especially strong because the format demands zero effort from the recipient.
Understanding these benchmarks helps you set realistic goals, allocate budget wisely, and measure success. To connect response data to actual revenue, our direct mail ROI calculator breaks it all down.
The response gap
House lists versus prospect lists
The biggest variable in any campaign is who you mail. House lists, the people who already bought from you or opted in, respond at dramatically higher rates than cold prospect lists. According to the ANA and DMA Response Rate Report, house lists generate response rates between 5 and 9 percent, while prospect lists typically land between 2 and 5 percent.
That gap makes sense. Someone who already knows your brand does not need convincing, they need a reason to come back, and a well-timed postcard with a personalized offer can trigger that return visit. For more on how mail stacks up against other channels, see our direct mail effectiveness research.
We mailed 2,000 postcards to our existing customer list and got a 7.3 percent response rate. The card quality from 4OVER4.COM made our brand look premium, which helped people keep the mailer instead of tossing it.
Marcus L., Restaurant Owner
By format
Response rates by mail format
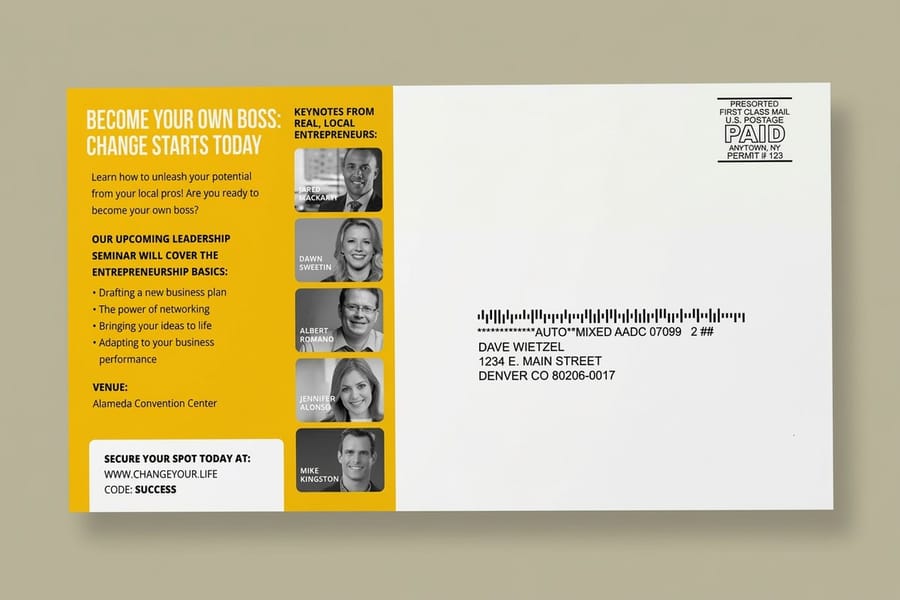
Not all formats perform equally, and the one you choose shapes the recipient experience before a single word is read. Postcards consistently deliver the highest response rates among standard formats because they require zero effort to engage with. The average response rate for direct mail postcards ranges from 4 to 5 percent for house lists, and oversized 6x9 or 6x11 cards tend to outperform standard 4x6 pieces.
Letter packages with personalized letters and reply devices average around 3.5 to 4 percent for house lists, and they work best for complex offers that need more explanation. Self-mailers and catalogs fall in the 2 to 3.5 percent range but often generate higher average order values, because the browsing experience encourages larger purchases.
For a comprehensive breakdown of every performance angle, our direct mail statistics hub covers it all.
By industry
Industry-specific response rates
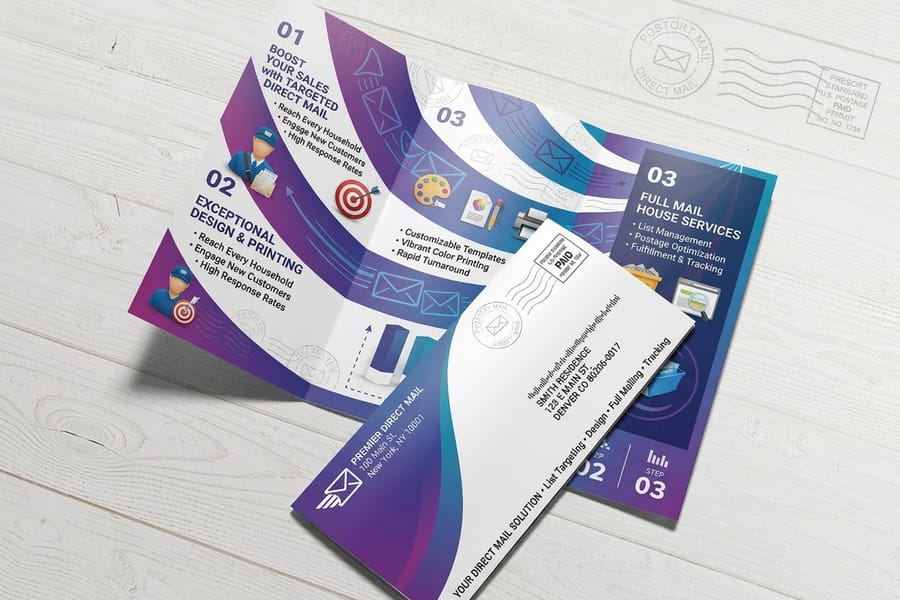
Your industry shapes what good looks like, since a 3 percent response can be exceptional in one vertical and disappointing in another. Nonprofit and fundraising campaigns see some of the highest rates, often 5 to 9 percent for donor house lists, because emotional storytelling paired with a physical ask is powerful.
Real estate mailers such as just sold postcards and neighborhood updates average 3 to 5 percent. Retail and e-commerce campaigns typically hit 3 to 4 percent with house lists, especially with a specific discount code, and financial services run 2 to 3 percent for prospects but reach 6 percent or more for existing account holders.
Healthcare and dental practices report strong results with appointment reminder postcards, averaging 4 to 6 percent for reactivation campaigns that target lapsed patients.
What moves the number
What drives higher response rates
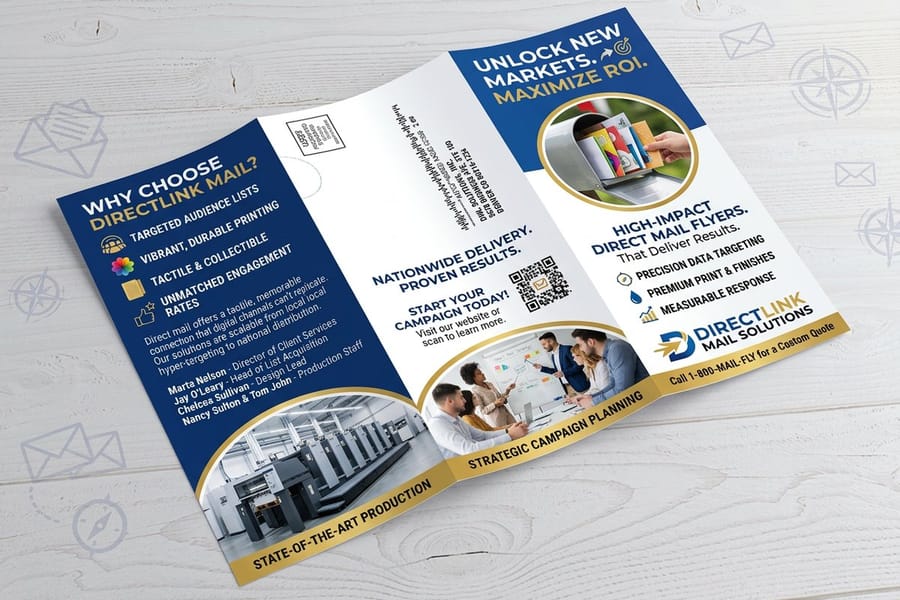
Response rates do not happen by accident. Personalization is the single biggest lever, and according to research from InfoTrends, personalized mail generates a 6 times higher transaction rate than non-personalized mail. Variable data printing lets you customize names, offers, images, and messaging for each recipient.
Paper quality and finish directly affect perceived value. A thick, textured postcard on 16pt or 32pt stock feels different in the hand than a flimsy sheet, and that tactile experience transfers to brand perception. 4OVER4.COM offers 60 plus paper types so you can match the stock to your positioning.
Offer strength matters more than clever copy, and a clear deadline lifts it further. Timing and frequency matter too, since sending 3 mailers over 6 weeks can raise cumulative response by 50 percent or more compared to a single drop.
Print quality
How print quality affects response rates
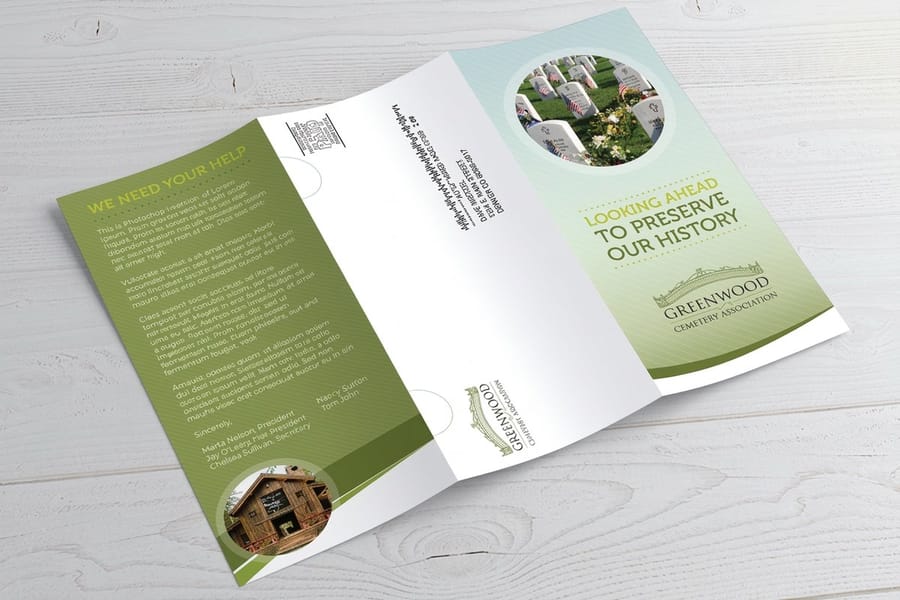
This is the part most data articles skip, but it matters. The physical quality of your mailer directly influences whether someone engages or tosses it. A study by the USPS Office of Inspector General found that physical ads cause more emotional processing in the brain than digital ads.
The weight, texture, and visual quality of a printed piece all feed that effect. 4OVER4.COM prints on stocks from 14pt to 32pt, and that 32pt option is roughly 3 times the thickness of standard mail. When recipients feel that heft, they pause, they look, and that pause is where your response rate lives.
I switched from a budget printer to 4OVER4.COM for our quarterly mailers. Same list, same offer, same design. Response rate jumped from 2.1 to 3.8 percent. The only variable was print quality.
Rachel K., Marketing Director, Dental Practice
Format and industry
Response rate benchmarks by format and industry
Not all formats or verticals respond at the same rate, but the trend is consistent: when you put a physical piece in someone's hands, they pay attention. Match the right format to the right audience and the numbers follow.
| Format | Typical response |
|---|---|
| Postcards (house list) | 4 to 5 percent, highest response per dollar, nothing to open. |
| Letter packages | 3.5 to 4 percent, best for complex or detailed offers. |
| Self-mailers and catalogs | 2 to 3.5 percent, higher average order value. |
| Oversized postcards | Outperform 4x6 formats, harder to miss in the mailbox. |
| Dimensional mailers | Highest open rates for high-value B2B targets. |
| Industry | Typical response |
|---|---|
| Nonprofit and fundraising | 5 to 9 percent for donor house lists. |
| Healthcare and dental | 4 to 6 percent for reactivation reminders. |
| Real estate | 3 to 5 percent for farm-area postcards. |
| Retail and e-commerce | 3 to 4 percent with a discount code. |
| Financial services | 2 to 3 percent prospects, 6 percent plus account holders. |
Your format choice should match your goal. Driving traffic to a website calls for postcards. Closing a high-value B2B deal calls for a dimensional mailer. Running a seasonal sale calls for catalogs or self-mailers. Each vertical has its own baseline, but the common thread is relevance.
Prove it
Tracking and measuring your response rate
You cannot improve what you do not measure. These methods attribute responses to the right campaign:
- Unique promo codes assign a code per campaign or segment so you can tie sales to the mailer.
- Dedicated URLs or landing pages that appear only on the printed piece.
- QR codes that track engagement in real time and bridge print to digital.
- Call tracking numbers unique to each campaign that route to your main line.
- Matchback analysis comparing your mail list against new customers in the response window.
Most responses land within 2 to 3 weeks, though some industries see them for 6 to 8 weeks. Set the window to your sales cycle, not an arbitrary date.
Side by side
How direct mail response compares to other channels
Response rate becomes most useful when you compare it against other channels. Marketers do not operate in a vacuum, and every dollar competes for the best return. The comparison below puts the direct mail response rate in context alongside email, paid social, and display advertising.
| Channel | Typical response or click-through |
|---|---|
| Direct mail | 2.7 to 4.4 percent average response, higher for house lists |
| 1 to 2 percent click-through rate | |
| Paid social | 0.5 to 1.5 percent click-through |
| Display ads | Below 0.1 percent click-through |
Direct mail wins on response rate and memorability, while digital wins on speed and cost per impression. The smartest marketers use both, and a postcard that drives someone to a landing page combines the strengths of each. For a detailed side-by-side, our direct mail vs email analysis lays out the full picture.
To make your next mailer impossible to ignore, consider formats like 3D postcards that add motion and depth right in the mailbox. Dimensional and specialty formats consistently outperform standard flat mail in both open rates and response rates.
Myths vs facts
Clearing up direct mail response rate myths
A few myths keep marketers from running mail that would pay off. The pairs below set each common assumption against what the response rate data actually shows, so you can plan on evidence rather than habit.
A 1 percent response rate is normal for direct mail.
The average sits between 2.7 and 4.4 percent, and house lists often clear 5 to 9 percent. At 1 percent, the list, offer, or creative needs work.
Postcards get thrown away too fast to work.
Postcards post the highest response per dollar because there is nothing to open, and heavier stock gets kept rather than tossed.
Response rate is the only number that matters.
Pair response rate with cost per acquisition and average order value, since catalogs can respond lower yet earn more per order.
One mail drop is enough to judge performance.
Most responses arrive within 2 to 3 weeks, and 3 mailers over 6 weeks can lift cumulative response by 50 percent or more.
Wally reads the response-rate data for you
Benchmarks are step one. Beating them is step two.
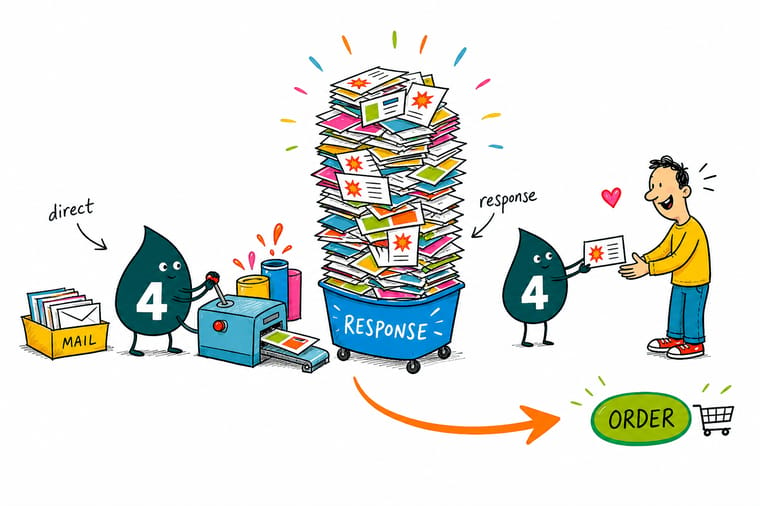
The numbers point one way. House lists beat prospect lists, postcards carry the highest response per dollar, and heavier stock gets kept instead of tossed. Wally's rule is simple. Mail the right list a clear offer on a premium piece, then track the response with a code or QR. That is how you clear the 2.7 to 4.4 percent average and push toward the 9 percent house-list ceiling.
Order postcards →From our press
Patterns from 10 billion plus printed pieces
Since 1999, 4OVER4.COM has produced 10 billion plus cards and prints, and the patterns are consistent. Clients who choose heavier stocks, 16pt and above, report stronger engagement, which tracks with the industry data on response rates. Thicker, more tactile pieces get held longer, read more carefully, and kept instead of discarded.
Finish selection plays a role too. Soft Touch matte and Spot UV coatings create a sensory contrast that draws the eye and the hand, and vivid color on premium stock sets a professional impression in the first second of contact. That first second decides whether your mailer gets read or recycled. For teams that want response without waste, our green printing options use sustainable materials without sacrificing tactile impact.
Proof, not promises
What our own mailing runs show on delivery, stock, and ratings
Here are the quality signals that round out the picture for marketers planning campaigns in 2026 and beyond. A 99.8 percent on-time delivery rate keeps your mailing schedule on track, and a 4.8 out of 5 average across 10,000 plus reviews shows the print quality holds up piece after piece, which is exactly the tactile edge that lifts response rates.
Stock, finishing and price
Postcard prices from 500 pieces, and the stocks behind them
For businesses ready to act on these numbers, here is current pricing for Postcards, the format with the highest response per dollar, alongside the full specifications so you can match the right stock and finish to your campaign goals.
| Quantity | Price Per Unit | Total |
|---|---|---|
| 50 | 33.0¢ | $16.48 |
| 100 | 24.2¢ | $24.16 |
| 200 | 15.9¢ | $31.86 |
| 300 | 12.8¢ | $38.45 |
| 400 | 11.3¢ | $45.04 |
| 500 | 10.3¢ | $51.62 |
| 600 | 9.89¢ | $59.31 |
| 700 | 9.57¢ | $67.00 |

Start from a blank
Mailing templates with the bleed and safe margins already drawn
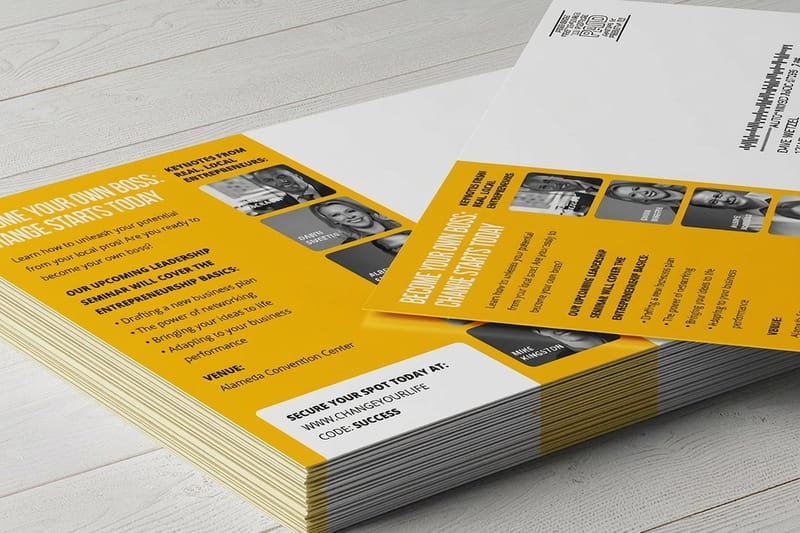
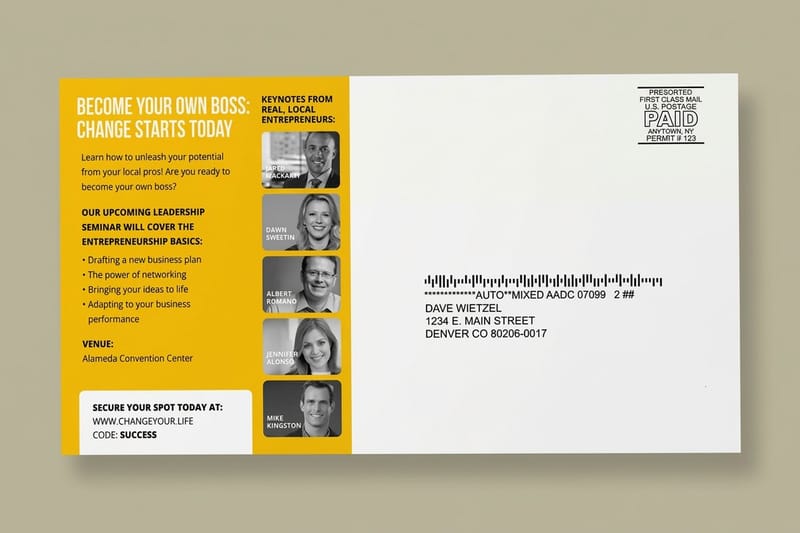
Each template below is set to the trim size with the bleed and safe margins already drawn, so the address block and the offer stay clear of the cut.
Print it
The mailing formats these response rates are measured on
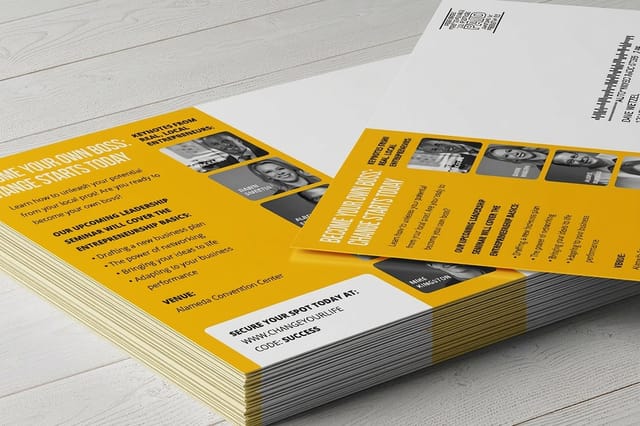
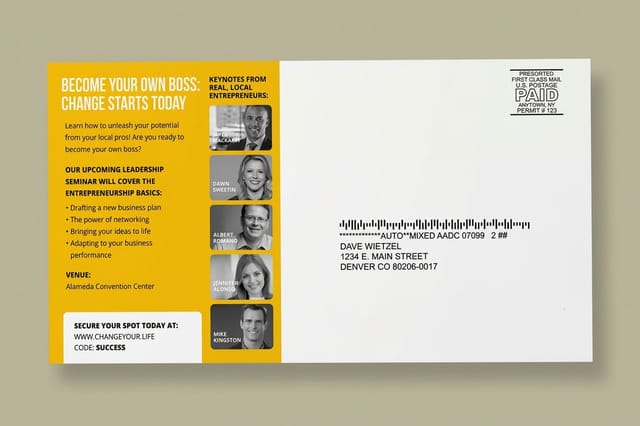
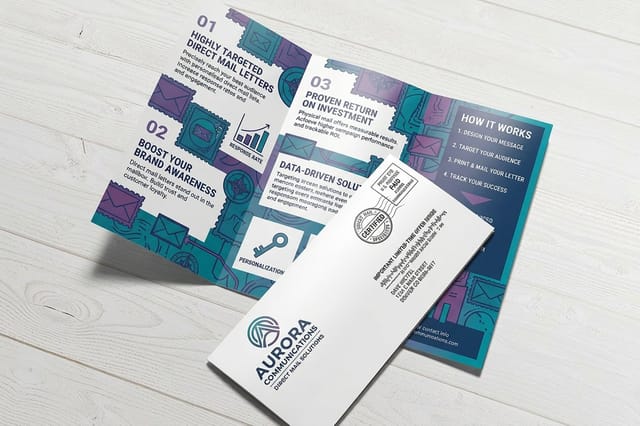
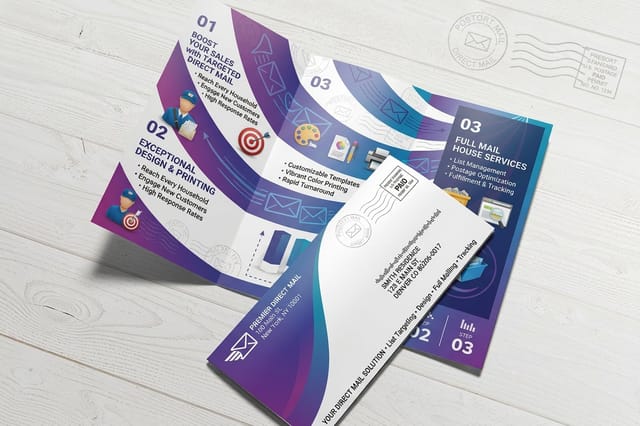
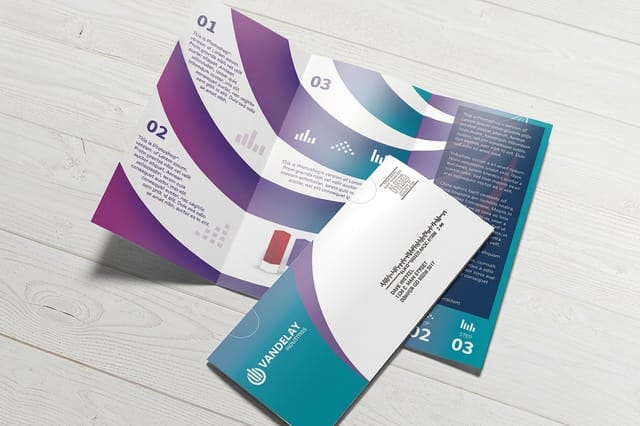
A benchmark stays a forecast until a piece is in the mail. Direct Mail Postcards start at 500 for $89.68 on 14pt or 16pt cover and print in 4 business days. Here are the products marketers reach for most when they put these numbers to work.

Why marketers trust us
Who prints the mail behind these response numbers
A response rate only counts if the mail lands when the campaign needs it. A 4.8 out of 5 average across 10,000 plus reviews and 150,000 plus businesses served sit behind these runs, and Direct Mail Postcards print in 4 business days, so the drop date you plan around holds.
How we built this
Which reports these response rate benchmarks come from
The benchmarks on this page come from published reports by the Data and Marketing Association, the Association of National Advertisers, the USPS, and InfoTrends, cross-referenced with 4OVER4.COM's 25 plus years of production data serving 150,000 plus businesses. All figures reflect the most recently available data, and where ranges are cited, they account for variations across industries, list types, and mail formats.

Get Started
Test a format: postcards from $89.68, letters and flyers from $238.73
Postcards run 500 for $89.68 on 14pt or 16pt cover and print in 4 business days. Letters, flyers, and brochures run 500 for $238.73 on 100# text and take 6.
Legal Disclaimer
Gold Standard guarantees apply to all standard orders placed through 4over4.com. Price match requires verifiable proof of a competitor's published price for an equivalent product with matching specifications and turnaround time. Satisfaction guarantee covers manufacturing defects and print quality issues. Contact support with order number and documentation. On-time delivery rate based on tracked orders 1999 to 2026. Individual results may vary based on shipping carrier performance.
Explore more
Response rate guides, mailing products, and postcard reviews
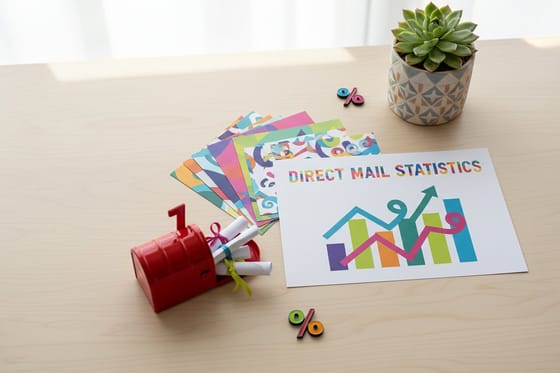 Statistics Direct Mail Statistics The full hub of response, ROI, and format data.
  Statistics Direct Mail ROI Turn response rates into revenue with the calculator.
 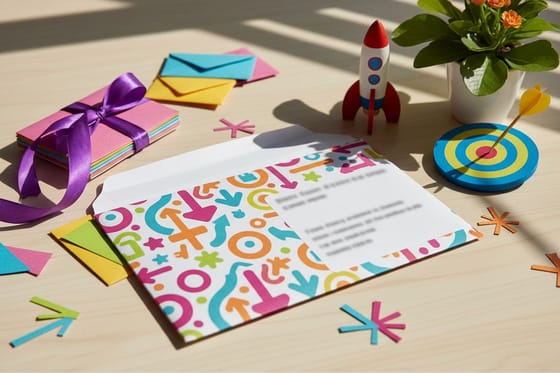 Statistics Direct Mail Effectiveness The engagement and recall research behind the numbers.
  Statistics Direct Mail vs Email Response, cost, and conversion side by side.
  Product Postcards Print the format with the highest response per dollar.
  Guide How to Make Postcards Design, print, and mail a campaign step by step.
 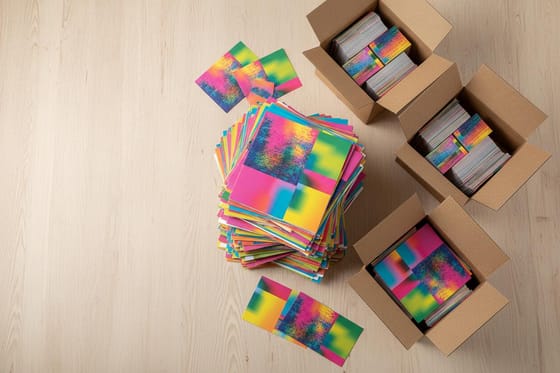 Benefit Bulk Discounts Per-piece price drops as your mailing quantity climbs.
  Alternative 4OVER4 vs PostcardMania How our postcard pricing and stock options compare.
  FAQs Printing FAQs Answers on stock, sizes, proofs, and mailing turnaround.
 Questions and answers
Common questions about direct mail response rates
Response rates by list, format, and channel, plus how to measure and improve them, answered.
What is a good direct mail response rate?
A good response rate depends on your audience. For house lists, anything above 5 percent is solid, and top performers hit 9 percent or higher. For prospect lists, 2 to 5 percent is strong. Across all campaigns and list types the average lands between 2.7 and 4.4 percent. Ready to test it, print your postcards and track the response.
What is the average response rate for direct mail postcards?
Postcards typically generate 4 to 5 percent for house lists, making them one of the highest-performing formats. Their advantage is instant visibility, since there is no envelope to open. Oversized postcards, 6x9 or larger, tend to outperform standard 4x6 cards because they are harder to miss in the mailbox.
How does the direct mail response rate compare to email?
Direct mail response rates average 2.7 to 4.4 percent, while email click-through rates typically sit between 1 and 2 percent. That is a 2 to 4 times advantage for physical mail, and mail responders tend to spend more per order. See the full direct mail vs email breakdown.
Does paper quality actually affect response rates?
Yes. Heavier stocks, from 16pt to 32pt, create a tactile impression that makes recipients pause and engage. Research from the USPS shows physical mail triggers stronger emotional processing than digital ads, and clients who upgrade to premium stock consistently report better campaign performance.
How long should I wait to measure my response rate?
Most responses arrive within 2 to 3 weeks of delivery, though B2B and high-consideration purchases can trickle in for 6 to 8 weeks. Set your measurement window to your sales cycle, and track with unique promo codes, dedicated URLs, QR codes, or call tracking numbers.
What is the best way to improve my response rate?
Focus on three things, list quality, offer strength, and print quality. Personalization with variable data can raise transaction rates up to 6 times, and 3 touches over 6 weeks outperform a single drop by 50 percent or more. Order free samples to pick the stock that gets kept.
