
Direct Mail Fundraising Statistics for 2026


Nonprofit response rates, average gift size, donor retention, and seasonal timing, set against the order data behind 25 plus years of printing appeals at 4OVER4.
Direct mail still drives most of the money nonprofits raise. Physical appeals influence 70 to 80 percent of individual donations, house lists respond at 5 to 9 percent, and the average mailed gift beats the online average. With 150,000 plus organizations printing with 4OVER4.COM and 10 billion plus cards produced, the data backs up what fundraisers already feel: a letter in the hand gets a gift.
Donor response in short
What direct mail fundraising statistics tell us in 2026
Direct mail fundraising statistics paint a clear picture. Physical mail still drives donations, and nonprofits that rely on printed appeals consistently outperform digital-only campaigns on response and average gift size. That is not nostalgia talking, it is data. 4OVER4.COM has printed 10 billion plus cards and mailers for 150,000 plus organizations, including nonprofits running year-round fundraising, so the patterns below come from both published research and our own presses. For peer to peer fundraising and for school fundraising results, the numbers favor mail.
Why it works
Why nonprofits still bet big on direct mail fundraising
Direct mail fundraising statistics reveal something that surprises a lot of digital-first marketers. Physical mail pieces do not just get opened, they get acted on. Prospect lists pull response rates near 2.9 percent, and a warm house list can reach 5.3 percent or higher. Set that against email response near 0.6 percent and the gap is hard to ignore.
For a wider view of how print performs, our breakdown of direct mail statistics puts these numbers in context. And if you want the dollars-and-cents case, the direct mail ROI page walks through the math behind every piece you send.
4OVER4.COM works with nonprofits of every size, from local animal shelters to national advocacy groups. We print the appeal letters, postcards, and self-mailers that turn a mailbox moment into a donation, and the data below shows why that approach keeps working year after year.
Response rates
Nonprofit direct mail response rates and fundraising performance
Nonprofit direct mail response rates consistently beat digital channels. The reason is simple. A physical letter demands attention in a way an inbox notification never can. You hold it, you read it, and if the ask is right, you respond. Roughly 70 to 80 percent of all individual donations to nonprofits are influenced by or made through direct mail appeals.
House lists of existing donors typically see response rates between 5 and 9 percent, while acquisition mailings to cold prospects land closer to 1 to 2 percent. Both figures dwarf email for the same campaign. Neuroscience research from the USPS and Temple University found that physical pieces drive more emotional processing and better recall than digital ads.
For organizations weighing direct mail effectiveness, the fundraising vertical offers some of the strongest proof points in the entire print marketing world.
We switched back to mailing printed appeals after two years of email-only campaigns. Our donor retention jumped noticeably and average gift sizes went up. There is something about holding a real letter.
Rachel K., Development Director, Regional Food Bank
Gift size
Average gift size from direct mail appeals
Here is where direct mail fundraising statistics get interesting for budget-conscious nonprofits. The average gift from a direct mail appeal runs 50 to 75 dollars for house list donors, according to Blackbaud Institute benchmarks. Online donations average a little lower, often in the 30 to 50 dollar range.
That higher average gift helps offset the per-piece cost of printing and mailing. Factor in lifetime donor value, since direct mail-acquired donors tend to give for 3 to 5 years on average, and the economics tilt even further toward print.
Our comprehensive direct mail hub covers how print performs across industries, not just fundraising, if you want to benchmark against the wider market.
Donor retention
Donor retention and direct mail's role
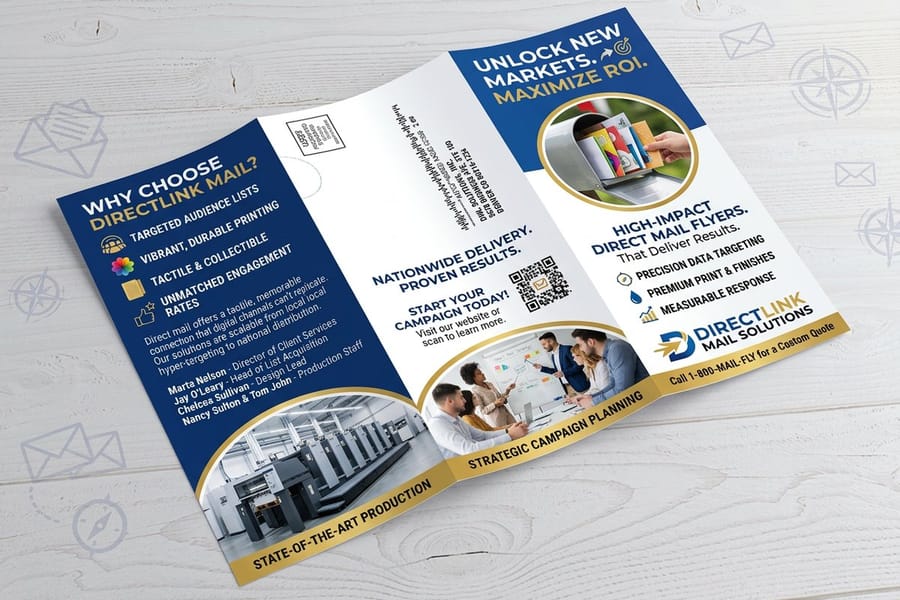
Donor retention is where direct mail truly earns its keep. The average nonprofit retains about 45 percent of its donors year over year, according to the Fundraising Effectiveness Project. Organizations that use regular direct mail touchpoints, thank-you letters, impact reports, and year-end appeals, consistently report higher retention than those leaning on email alone.
Why does it work? Print feels personal. A handwritten note on a printed letter or a photo of the family your donor helped does not translate well to a 600-pixel email template. 4OVER4.COM prints thank-you postcards, impact report mailers, and year-end appeal letters on 60 plus paper types, and a heavier stock like 16pt or 32pt sends a quiet signal that your organization takes its donors seriously.
Our year-end appeal on thick, textured cardstock pulled a 7.2 percent response rate. That is the best we have ever done. The paper quality made people stop and read.
Marcus T., Fundraising Coordinator, Youth Mentoring Nonprofit
Schools and PTAs
School fundraising statistics and direct mail
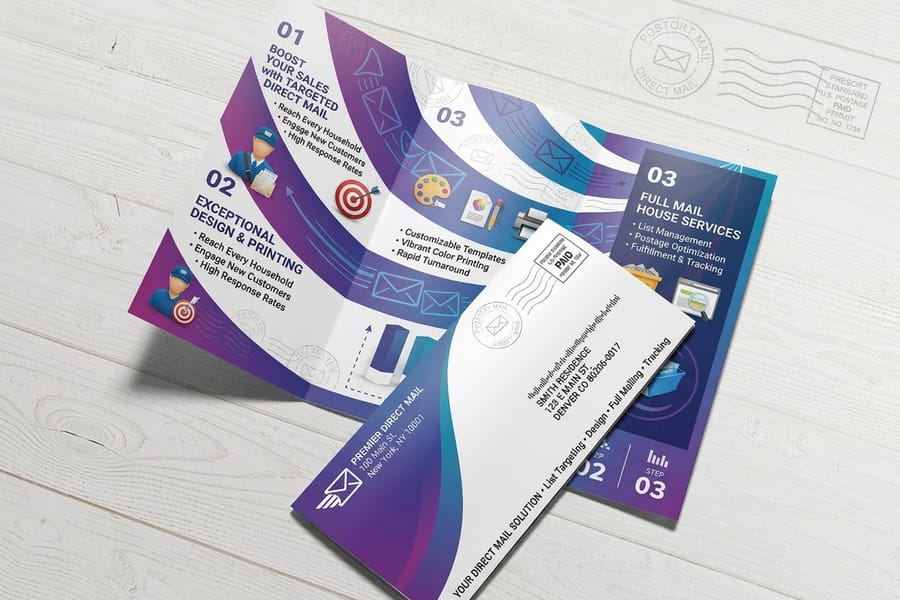
School fundraising statistics show a pattern of their own. Parent engagement drives everything, and direct mail reaches parents where digital often does not. Not every parent checks the school app, but nearly every parent opens a letter from their kid's school.
PTAs and school foundations that send printed fundraising appeals report participation rates 20 to 30 percent higher than email-only campaigns, according to National PTA surveys. The physical piece acts as a reminder that sits on the fridge or the counter until action is taken.
For schools running silent auctions, fun runs, or annual fund drives, a well-designed postcard or letter is the most reliable way to get families involved. The cost per piece is low, especially when printed in bulk through 4OVER4.COM, and the return on participation makes it worthwhile.
Budgets and seasons
Where direct mail fits in the nonprofit marketing mix
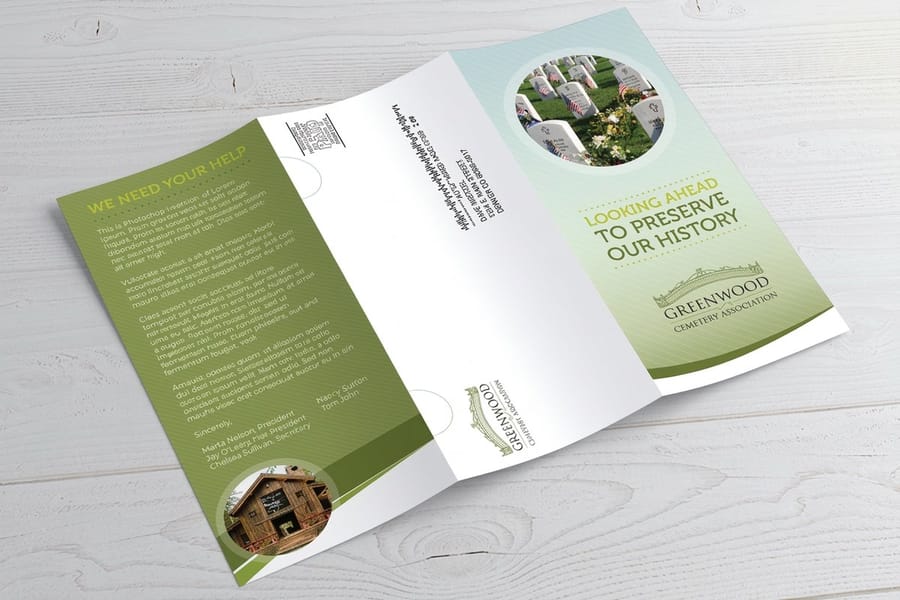
Broader nonprofit marketing statistics confirm that organizations put a meaningful chunk of their budgets into direct mail. Per the M+R Benchmarks Report, nonprofits spend roughly 15 to 20 percent of their marketing budgets on direct mail even as digital spending grows. That is strategy, not inertia. A donor who receives a printed appeal and then a follow-up email is more likely to give than someone who only gets the email, and multichannel campaigns that include direct mail see response rates 28 percent higher than single-channel digital.
Timing matters too. Year-end giving in November and December accounts for roughly 30 percent of all annual charitable donations, and nonprofits that mail early in November tend to outperform those that wait until December. Spring appeals from March through May are the second-strongest window.
Understanding the average direct mail response rate across sectors helps nonprofits benchmark their own performance and set realistic goals for each campaign.

By the numbers
Donor response and cost per dollar raised in four numbers
Here are the headline figures fundraisers reach for first when they plan an appeal, drawn from the Data and Marketing Association, the Association of Fundraising Professionals, the Blackbaud Institute, and our own production data. Direct mail influences most individual giving, house lists respond far above cold lists, and the average mailed gift runs higher than an online donation. Set those benchmarks against 25 plus years of printing appeals at 4OVER4.COM and the picture is consistent: the pieces donors can hold get acted on.
Format and cost
Which formats and windows raise the most
Not every fundraising format performs the same, and cost per dollar raised swings widely between acquisition and retention mail. Match the right piece and the right season to your ask, and the numbers follow.
| Format | Where it wins |
|---|---|
| Appeal letters | Room for a personal story, strongest for detailed year-end asks. |
| Postcards | Highest response per dollar, no envelope to open, instant visibility. |
| Self-mailers | Cost-effective middle ground, great for event and campaign invites. |
| Reply cards | Make giving frictionless with a prepaid return donation card. |
| Impact reports | Photo-driven mailers that deepen retention between appeals. |
| Scenario | What to expect |
|---|---|
| Acquisition mail | Costs $1.00 to $1.50 per dollar raised, an investment recovered on repeat gifts. |
| House list mail | Costs just $0.15 to $0.25 per dollar raised, the profit center of the program. |
| Year-end window | Roughly 30 percent of annual giving, so mail early in November to beat the crowd. |
| Spring window | The second-strongest window from March to May, often tied to matching gifts. |
Experienced fundraisers treat acquisition mail as an investment and retention mail as the profit center. Keeping print costs low is what makes the math work, so printing appeal postcards and letters in bulk through direct mail fundraising volumes brings your cost per dollar raised down.
Print quality and trust
Print quality and donor perception
Donors notice print quality. A flimsy letter on thin paper signals a struggling organization, which is not always the impression you want. A crisp, well-designed appeal on sturdy stock signals competence and care. Research from the Envelope Manufacturers Association found that 70 percent of consumers say direct mail feels more personal than digital communication, and for nonprofits that personal feeling translates directly into trust and willingness to give.
The paper you choose matters. A textured, uncoated stock feels warm and authentic, which suits a personal appeal signed by hand. A glossy, coated stock works well for an impact report full of vivid photography. 4OVER4.COM's range of 60 plus paper types lets you match the feel of the mailer to the tone of your message.
Proof, not promises
What our appeal printing shows on stock and turnaround
Here are the trust signals behind the benchmarks, the delivery, quality, and volume figures that round out the picture for fundraisers planning appeals in 2026 and beyond. A 99.8 percent on-time delivery rate keeps your year-end schedule on track, and a 4.8 out of 5 average rating across 10,000 plus verified reviews shows the print quality holds up piece after piece.
Side by side
Mail against email and peer to peer on gift size
Direct mail fundraising statistics become most useful when you stack them against other channels. Nonprofits do not operate in a vacuum, they are choosing between mail, email, and peer to peer fundraising for every dollar. For a detailed print versus digital breakdown, our direct mail vs email analysis covers response rates, cost efficiency, and donor lifetime value across both channels.
| Channel | Trust | Response | Average gift | Best for |
|---|---|---|---|---|
| Direct mail | High, donors hold and keep it | 5 to 9 percent house list | $50 to $75 average gift | Best for retention |
| Lower, easy to skip | Around 0.6 percent response | $30 to $50 average gift | Fast acknowledgements | |
| Peer to peer | Social, built on sharing | Driven by network reach | Smaller average gifts | Pairs with a mailed kickoff |
| Multichannel | Print plus digital touch | 28 percent higher response | Combines both channels | Strongest overall |
Direct mail costs more per impression but delivers higher response, larger average gifts, and better donor retention. Email costs less to send but generates lower engagement and shorter donor lifespans. Peer to peer fundraising statistics show strong digital sharing yet smaller average gifts, and even those programs perform better when paired with a mailed kickoff piece that gives the campaign a physical anchor.
The smartest nonprofits use both. A printed appeal followed by an email reminder, or a thank-you postcard after an online donation, combines the strengths of each channel and lifts overall results.
Wally turns the data into your next appeal
Statistics are only step one. The mailer is step two.
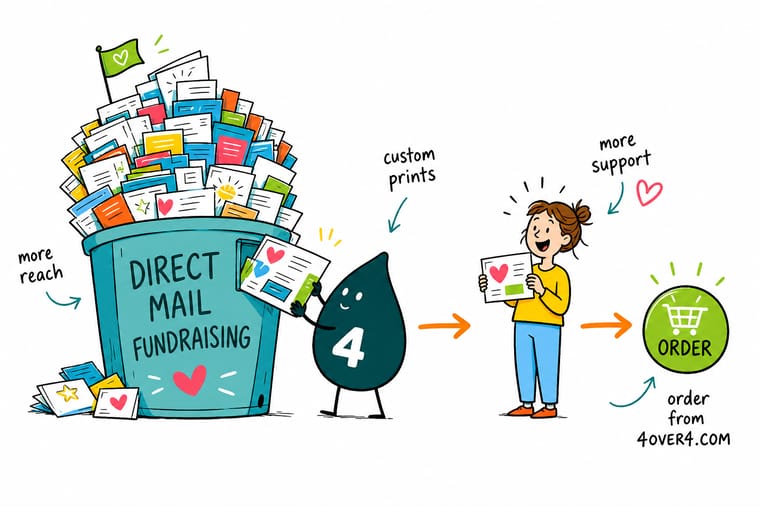
The numbers all point the same way: a premium appeal in a donor's hands beats a message lost in their inbox. Wally's rule is simple. Segment your house list from cold prospects, print heavy on stock that signals a serious organization, and mail early in the year-end window. Postcards carry the highest response per dollar, so they are the fastest way to put this fundraising data to work.
Order fundraising mailers →Myths vs facts
What boards get wrong about the cost of an appeal
A few myths keep nonprofits from mailing appeals that would pay off. The pairs below set each common assumption against what the direct mail fundraising statistics actually show, so you can plan your next campaign on evidence rather than habit.
Direct mail is dead for fundraising.
Direct mail still drives 70 to 80 percent of individual donations to nonprofits and outperforms email on both response rate and average gift.
Younger donors ignore printed appeals.
Physical mail earns more emotional processing and recall across ages, and printed pieces feel more personal than a digital ask.
Acquisition mail loses money, so skip it.
The first gift often costs more than it raises, but mail-acquired donors give for 3 to 5 years, so lifetime value pays it back.
Paper stock does not affect giving.
Heavier, textured stock signals a serious organization, and appeals on premium cardstock have pulled response rates above 7 percent.
Stock, finishing and price
Fundraising mailer pricing and specifications
For nonprofits ready to act on these numbers, here is current pricing for postcards, the fundraising format with the highest response per dollar, alongside the full specifications so you can match the right stock and finish to your appeal.
| Quantity | Price Per Unit | Total |
|---|---|---|
| 50 | 33.0¢ | $16.48 |
| 100 | 24.2¢ | $24.16 |
| 200 | 15.9¢ | $31.86 |
| 300 | 12.8¢ | $38.45 |
| 400 | 11.3¢ | $45.04 |
| 500 | 10.3¢ | $51.62 |
| 600 | 9.89¢ | $59.31 |
| 700 | 9.57¢ | $67.00 |

Start from a blank
Blank templates for fundraising mailers
Need a head start on design? These blank templates for direct mail pieces make it easy to get your appeal print-ready, with bleed and safe margins already built in.
Print it
The direct mail products nonprofits reach for most
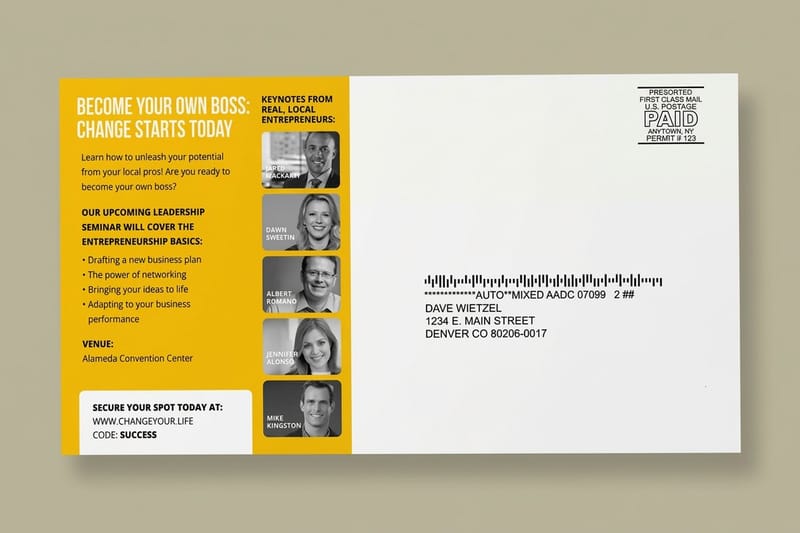
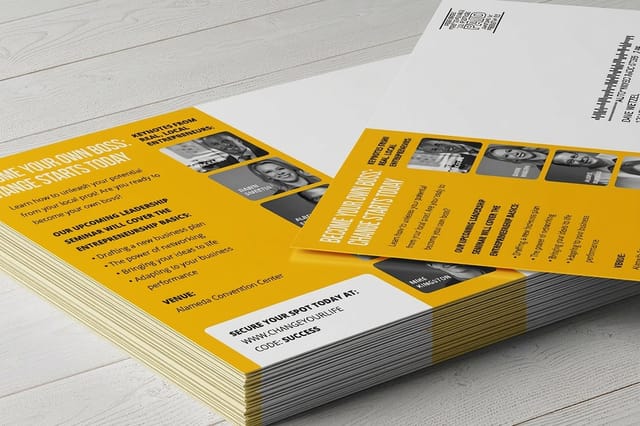
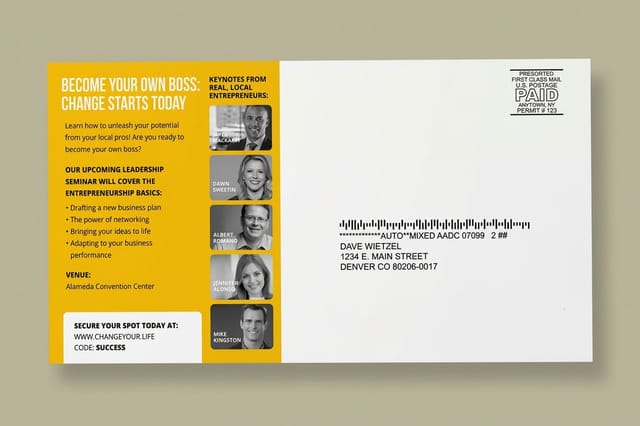
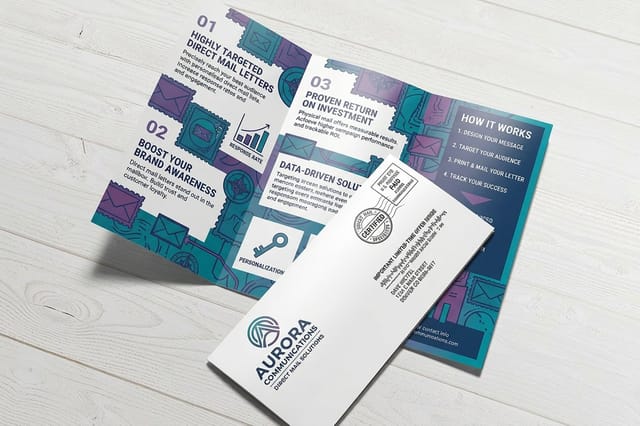
Direct Mail Letters run 500 for $238.73 on 100# text or 70# uncoated text and print in 6 business days. Direct Mail Postcards run 500 for $89.68 and print in 4. These are the pieces nonprofits order for an appeal.

What our print data reveals
What 4OVER4 order data says about nonprofit mail
Direct mail fundraising statistics from third-party sources are valuable, but 4OVER4.COM's own data, drawn from 150,000 plus organizations ordering print over 25 plus years, adds another layer. Nonprofit print orders spike heavily in October and November as organizations prepare year-end appeals. Postcards and self-mailers are the most popular formats, followed by letter-sized appeal sheets and donation reply cards.
Heavier paper stocks of 16pt and above are increasingly popular among nonprofits. Organizations report that thicker mailers feel more professional and get opened before the rest of the stack. Nonprofits that invest in quality print materials tend to reorder at higher rates, a strong signal that their campaigns perform well enough to justify the spend. With 10,000 plus reviews and a 4.8 out of 5 star rating, 4OVER4.COM consistently delivers the print quality fundraisers need.
The quality of 4OVER4.COM's mailers made our year-end appeal feel like a premium brand experience. Response rates were the best we have seen in three years of mailing.
Verified customer, Nonprofit Development Manager
Why fundraisers trust us
The press that runs these nonprofit appeals
Every benchmark on this page sits on a long record of getting mail printed right. A 4.8 out of 5 average across 10,000 plus reviews, 150,000 plus organizations served, and direct mail printed since 1999 are the trust signals behind the numbers, so you can plan an appeal knowing the pieces will land sharp and on time.
How we built this
Where these donor response figures come from
The direct mail fundraising statistics on this page come from published reports by the Data and Marketing Association, the Blackbaud Institute, M and R Benchmarks, the Association of Fundraising Professionals, and the Fundraising Effectiveness Project. 4OVER4.COM's internal data reflects order patterns from 150,000 plus organizations over 25 plus years in business. All figures represent the most recent available data and are updated as new reports are published.

Get Started
Print 500 appeal letters for $238.73, mailed in 6 business days
Pick a format, drop in your appeal design or a free template, and we will print it sharp on premium stock and ship it on time.
Legal Disclaimer
Gold Standard guarantees apply to all standard orders placed through 4over4.com. Price match requires verifiable proof of a competitor's published price for an equivalent product with matching specifications and turnaround time. Satisfaction guarantee covers manufacturing defects and print quality issues. Contact support with order number and documentation. On-time delivery rate based on tracked orders 1999 to 2026. Individual results may vary based on shipping carrier performance.
Explore more
Fundraising appeals, mailing formats, and donor guides
 Statistics Direct Mail Statistics The full industry data set behind print performance.
  Statistics Direct Mail ROI Run the numbers on cost per dollar raised.
  Statistics Direct Mail Effectiveness The engagement and recall research behind the numbers.
  Statistics Response Rate Benchmarks Average response rates across sectors and list types.
  Statistics Direct Mail vs Email Print and email compared on cost and conversion.
  Case study Nonprofit Mail Case Study How a nonprofit doubled donations with direct mail.
 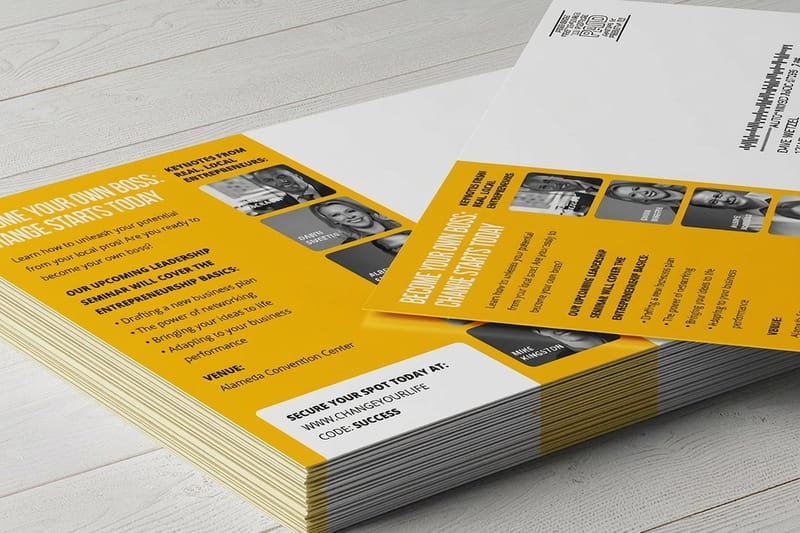 Product Direct Mail Postcards The workhorse format for fundraising appeals.
  Guide How to Make Postcards Design, print, and mail an appeal step by step.
  Benefit Same Day Printing Keep an urgent fundraising appeal on schedule.
  FAQs Printing FAQs Answers on stock, sizes, proofs, and mailing turnaround.
 Questions and answers
Common questions about fundraising mail performance
Response rates, cost per dollar raised, peer to peer comparisons, paper stock, and timing, answered.
What response rate should a nonprofit expect from direct mail fundraising?
Nonprofit direct mail response rates typically run 5 to 9 percent for house lists of existing donors and 1 to 2 percent for acquisition mailings to new prospects. Rates vary with list quality, creative design, seasonality, and the strength of the ask, and they consistently beat email and social media for charitable giving.
Is direct mail still worth the cost for small nonprofits?
Yes. Acquisition mailings may cost $1.00 to $1.50 per dollar raised at first, but house list mailings cost only $0.15 to $0.25 per dollar raised, and long-term donor value makes the upfront spend worthwhile. Small nonprofits keep costs low by printing postcards and self-mailers in bulk through 4OVER4.COM.
How do peer to peer fundraising statistics compare to direct mail?
Peer to peer fundraising leans on social sharing and digital engagement, but average gift sizes tend to be smaller than mailed gifts. The best campaigns combine both, a printed kickoff mailer paired with digital sharing tools, and that multichannel approach outperforms either channel alone.
What paper stock works best for fundraising mailers?
Uncoated stocks feel personal and authentic for appeal letters, while glossy or satin-coated stocks make photography pop on impact reports and postcards. Heavier stocks of 16pt and above read as professional the moment the envelope is opened. 4OVER4.COM offers 60 plus paper types to match any campaign tone. Order Free Samples to feel them first.
When is the best time to send fundraising direct mail?
Year-end from November to December drives roughly 30 percent of annual charitable donations, and spring from March to May is the second-strongest window. Mailing early in each window, before the mailbox gets crowded, tends to produce better results. Need speed? Same Day Printing keeps an urgent appeal on schedule.
How do school fundraising campaigns benefit from direct mail?
School fundraising statistics show printed appeals reach parents more reliably than digital-only outreach. PTAs report participation rates 20 to 30 percent higher when they use direct mail alongside digital, since a postcard on the fridge is a constant reminder an email cannot match. Visit our Help Center for tips on designing effective school fundraising mailers.
