
Content Marketing Statistics for 2026


ROI, B2B, B2C, and visual content trends, set against the order data behind 25 plus years of printing for content-driven brands at 4OVER4.
Content marketing costs less and returns more when digital and print work together. It runs about 62 percent cheaper than traditional marketing while generating roughly three times the leads, and pairing content with a printed piece lifts response beyond digital alone. With 150,000 plus businesses printing with 4OVER4.COM and 10 billion plus cards produced, the data backs up what marketers already feel.

Content ROI
What the content marketing statistics tell us
Content marketing statistics reveal where businesses are spending, what is working, and where the biggest gaps remain. For brands that combine digital content with physical print, the data points toward stronger engagement and higher recall. This page pulls the numbers that matter into one place, from B2B and B2C behavior to ROI and growth, so you can allocate budget smarter and stop wasting money on channels that do not perform. Explore the wider small business statistics hub for the full picture.
By the numbers
Cost per lead, ROI, and conversion against paid media
Here are the headline figures marketers reach for first when they build a plan, drawn from published research and our own production data. Content marketing runs far cheaper than traditional advertising while generating more leads, B2B teams keep raising its priority, and global spend is on track to pass 100 billion dollars. Set those benchmarks against 25 plus years of printing content pieces at 4OVER4.COM and the picture is consistent: the brands that pair data with a tangible piece pull ahead.

Why it matters
Why content marketing statistics matter for your budget

Content marketing statistics are not just numbers on a screen. They are a roadmap. Every dollar you put toward blog posts, video, social media, or printed collateral should be backed by data that proves it works. The businesses that track performance and adjust against real benchmarks consistently outperform the ones that guess. 4OVER4.COM works with more than 150,000 businesses that blend digital and print, and we see firsthand how content marketing growth statistics shape ordering patterns.
The value shows up when you connect a number to a decision. Companies investing in content create more branded materials, more often, so the first move is knowing where the returns are. For broader context, our small business marketing statistics show how the channel mix is shifting, and the wider small business statistics tie growth to marketing spend.
Start with the data, then let the budget follow the numbers rather than the other way around. Earn Coins with every order and roll those savings straight back into your next campaign, so smarter spending compounds run after run.
B2B
B2B content marketing statistics and spending trends

B2B content marketing statistics tell a clear story. Businesses selling to other businesses lean on educational content, from whitepapers and case studies to blog posts and email newsletters. In the Content Marketing Institute 2024 B2B report, 71 percent of B2B marketers said content marketing had grown more important to their organization over the past year. That is a fundamental shift in how companies attract and keep clients, and the spending follows the sentiment.
Content does not stop at the screen. Trade show materials, printed case studies, branded folders, and business cards extend the content experience into physical space. When a prospect reads your blog post online and later picks up a well-printed leave-behind at a conference, that is content marketing working across channels. B2B buyers typically consume three to seven pieces of content before they talk to a sales rep, so every touchpoint has to pull its weight.
Email remains the top distribution channel for B2B content, with LinkedIn close behind, yet in-person events and printed materials still rank among the most effective channels for engagement. Digital gets the reach. Print gets the retention. Understanding the small business failure rate makes it clear why consistent marketing investment matters for long-term survival.
B2C
B2C content marketing statistics and consumer behavior

B2C content marketing statistics paint a different picture. Consumer brands lean harder into visual content, from video and social imagery to interactive formats. The emotional connection matters more in B2C, and visuals deliver it faster than text alone. Short-form video on Reels, TikTok, and YouTube Shorts has become the highest-performing format many consumer marketers run.
The data on visual content is striking. Posts with images earn 2.3 times more engagement on social platforms than text-only posts, and video generates far more shares than text and images combined. But visual content is not limited to screens. Printed visual materials, from posters and banners to flyers and brochures, still outperform digital ads on recall, because people remember what they can hold.
For B2C brands, pairing digital content with printed materials creates a multi-sensory experience. A customer sees your social ad, visits your site, then receives a beautifully designed postcard in the mail. That layered approach drives higher conversion than any single channel alone, which is why the early-stage brands in our startup statistics invest in tangible pieces from day one.
ROI
Content marketing ROI statistics and performance benchmarks
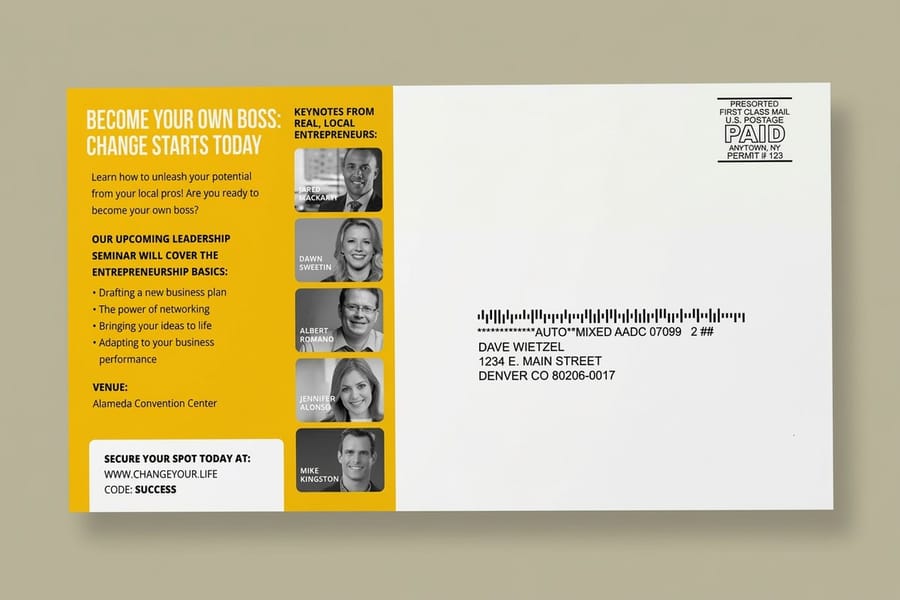
Content marketing ROI statistics are what keep finance teams interested and marketing directors employed. The numbers are encouraging. Content marketing costs 62 percent less than traditional marketing while generating roughly three times as many leads, according to DemandMetric. That cost efficiency is why content budgets keep climbing year over year.
Measurement is still the hard part. The companies that succeed use multi-touch attribution that tracks a customer whole journey, from first blog visit to final purchase. Top-of-funnel content gets measured by traffic and engagement, mid-funnel content by lead generation, and bottom-of-funnel content by conversion rate and deal size. Print often shows its strongest ROI at the bottom, where a printed case study handed over in a sales meeting carries weight that is hard to replicate on a screen.
Knowing your small business marketing budget benchmarks helps you split spend between digital content creation and printed materials for the best return. Review the small business statistics hub to see how growth and marketing spend connect across stages.
Growth
Content marketing growth statistics and industry trajectory
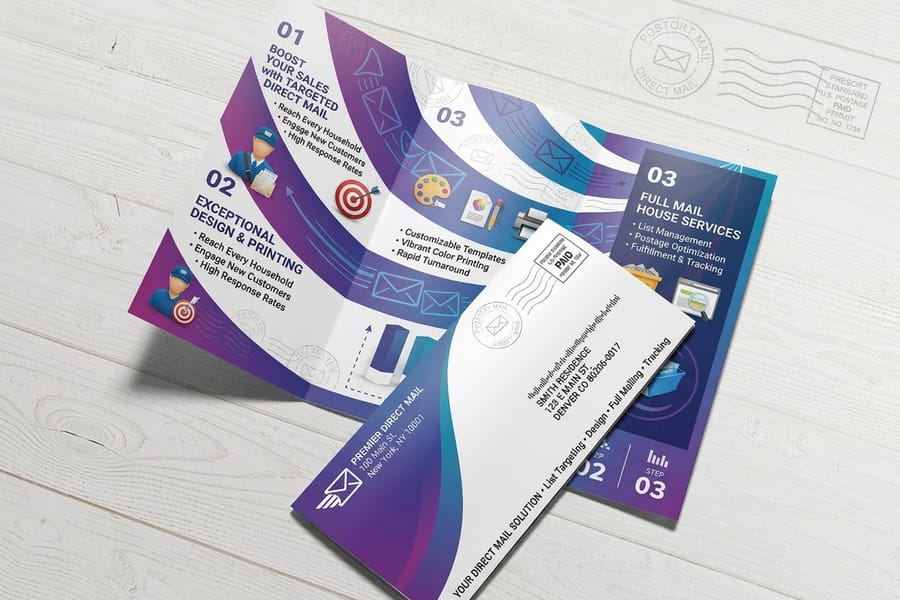
Content marketing growth statistics show an industry still expanding fast. Global content marketing revenue is projected to pass 100 billion dollars by 2026, up from roughly 63 billion in 2022. That trajectory reflects how central content has become to every kind of business, from solo freelancers to Fortune 500 brands. The growth is in more than spending. It is in sophistication, as AI-assisted creation, personalized experiences, and omnichannel strategies become standard practice rather than an edge.
Video and interactive formats grow fastest, but print-integrated strategies are seeing a resurgence too. Direct mail response rates have risen as digital ad fatigue grows, and smart marketers combine content with printed touchpoints that a crowded inbox cannot bury. Campaigns that pair digital content with direct mail see response rates 28 percent higher than digital-only efforts, according to the Data and Marketing Association.
4OVER4.COM has watched this play out. Businesses that invest in content marketing tend to order more printed materials, not fewer. Content creates demand and print fulfills it. A well-written blog post drives traffic, and a beautifully printed brochure or business card turns that traffic into customers. For brands that want their content to carry a sustainability message, our green printing options let the printed pieces match the values in the copy.
From data to growth
Turning content marketing data into real growth
Numbers without context are just noise. The real value of content marketing statistics comes when you tie each one to a channel and measure what actually moves revenue. Blog posts build awareness, whitepapers build credibility, and printed proposals and branded materials close deals, so the smartest programs run all three in sequence rather than betting on a single format.
Print is the channel digital-first teams overlook most. A prospect reads your content online, engages with your brand, then meets you at an event, and that is where business cards, folders, and lookbooks take over as physical content that reinforces the digital message. Our printing guides walk through how to prepare files so those pieces land as sharp as the copy that earned the click.
Where content wins
How each format and industry performs
Not every content format returns the same, and the right mix shifts by industry, but the trend is steady. When you put a physical piece in someone hands, they pay attention. Match the format to the funnel stage and the audience, and the numbers follow.
| Format | Where it wins |
|---|---|
| Blog posts | Build awareness and organic search traffic at the top of the funnel. |
| Whitepapers and case studies | Build credibility and generate qualified B2B leads mid-funnel. |
| Short-form video | Drives B2C discovery and social engagement fastest. |
| Printed brochures and folders | Convert and retain at the bottom of the funnel, in the hand. |
| Postcards and direct mail | Re-engage prospects and lift response when paired with digital. |
| Industry | How they use it |
|---|---|
| B2B services | Whitepapers, case studies, and printed leave-behinds close deals. |
| E-commerce and retail | Video, social imagery, and catalogs drive discovery and repeat sales. |
| SaaS and tech | Educational blogs and documentation build trust before the demo. |
| Local and small business | Blog plus postcard combinations reach a concentrated audience. |
| Nonprofit | Story-led content and printed appeals lift engagement and giving. |
Your format choice should match your goal. Driving traffic calls for blog posts and video. Building credibility calls for whitepapers and case studies. Closing a deal in person calls for a printed brochure or folder. Each industry has its own benchmarks, but the common thread is relevance at the right moment.
Proof, not promises
Content-driven print by the numbers at 4OVER4
Here are the figures from our side of the press, the volume, review, and quality signals that round out the picture for marketers planning content-driven campaigns. More than 10 billion cards printed, over 150,000 businesses served, and a 99.8 percent on-time delivery rate mean the benchmarks on this page sit on a long record of getting printed content right.
Stock, finishing and price
Brochure pricing and specifications
For teams ready to act on these numbers, here is current pricing for Brochures, the printed content piece that converts at the bottom of the funnel, alongside the full specifications so you can match the right stock and finish to your campaign.
| Quantity | Price Per Unit | Total |
|---|---|---|
| 50 | $1.14 | $57.11 |
| 100 | 82.4¢ | $82.38 |
| 200 | 53.3¢ | $106.55 |
| 300 | 41.0¢ | $123.02 |
| 400 | 34.9¢ | $139.49 |
| 500 | 31.2¢ | $155.97 |
| 600 | 26.7¢ | $160.36 |
| 700 | 23.5¢ | $164.75 |

Wally turns the data into your next print run
Statistics are step one. The right printed piece is step two.
Content returns more when a tangible piece backs up the digital message, because people remember what they can hold. Wally's rule is simple. Match the format to the funnel stage, print it on a stock that signals quality, and add one digital follow-up. Standard Brochures start at 50 for $57.11 on 100# Gloss Text and print in 3 business days.
Print your brochures →Side by side
Digital versus print content performance
Content marketing statistics become most useful when you compare channels directly. The debate between digital and print is not really a debate at all. It is about knowing where each channel performs best and using both strategically. The table below puts the core content channels in context, from reach to recall to cost.
| Channel | Strength | Best role | Cost | Trackable |
|---|---|---|---|---|
| Blog and SEO content | Wide reach, compounding traffic | Best for awareness and search | Low cost per visit | Yes, with analytics |
| Short-form video | High engagement, fast attention | Best for B2C discovery | Variable production cost | Yes |
| Email newsletters | Direct, owned audience | Around 20 percent open rate | Very low per send | Yes |
| Printed collateral | Highest recall, tactile trust | Strong at the bottom of funnel | Higher per piece | Yes, with codes and QR |
Digital content excels at reach and scalability. You can publish a blog post and reach thousands within hours. Print excels at engagement depth and memorability, since a printed piece stays on a desk for weeks. The highest-performing brands do not choose one over the other, they integrate both. Use digital content to attract and educate, and use print to convert and retain.
For B2B specifically, the gap widens. Decision-makers are harder to reach through digital channels because of spam filters and inbox fatigue, so a well-designed mailer or leave-behind bypasses the noise. That is why content-driven businesses order more print as they grow, not less.
Myths vs facts
What content teams get wrong about print and ROI
A few myths keep teams from running content that would pay off. The pairs below set each common assumption against what the content marketing statistics actually show, so you can plan your next campaign on evidence rather than habit.
Content marketing is only about digital channels.
The highest-performing programs pair digital content with printed pieces. Campaigns that combine both see response rates 28 percent higher than digital-only efforts.
You cannot measure the ROI of content marketing.
Multi-touch attribution tracks the full journey from first blog visit to purchase, and unique codes or QR links make printed pieces just as measurable as digital.
Video and blogs have made print obsolete.
Printed materials still outperform digital ads on recall because people remember what they can hold, which is why content-driven brands order more print, not less.
Content marketing is too expensive for smaller teams.
Content marketing costs about 62 percent less than traditional marketing while generating roughly three times as many leads, so a lean team can still compete.
Print it
The print products content teams reach for most
Standard Brochures start at 50 for $57.11 on 100# Gloss Text, 100# Silk Matte Text, or 70# Uncoated Text and print in 3 business days. Standard Rack Cards run 50 for $42.84. These are the pieces content teams order for the offline half.





What our print data reveals
What 4OVER4 order data says about content-driven businesses
Content marketing statistics from third-party research are valuable, but our own order data adds a layer the reports miss. With more than 10 billion cards printed and over 150,000 businesses served since 1999, we have watched ordering patterns shift alongside content marketing trends, and the correlation is clear.
Businesses that keep active blogs and social accounts order printed materials more frequently and in greater variety. They do not just order business cards, they order postcards, brochures, banners, and branded stationery. Content-driven companies think about their brand across every touchpoint, digital and physical, because the same priorities that produce good content also produce polished print. Every order is backed by our 5 Gold Guarantees, so you can act on the data with zero risk.
We started creating blog content to drive traffic, then realized our printed leave-behinds were closing more deals than our landing pages. Combining the two changed everything for our sales team.
Verified customer, Marketing Director
Why marketers trust us
The press behind the printed half of a content program
Every benchmark on this page sits on a long record of getting content-driven print right. A 4.8 out of 5 average across 10,000 plus reviews, 150,000 plus businesses served, and print delivered since 1999 are the trust signals behind the numbers, so you can plan a campaign knowing the pieces will land sharp and on time.
How we built this
The research behind these content marketing figures
Every content marketing statistic on this page comes from published industry reports, recognized research organizations, and 4OVER4.COM internal order and review data spanning 25 plus years. We cross-reference multiple sources before including any data point, and all figures reflect the most recent available research. We update this page regularly as new data becomes available to keep the numbers accurate and actionable for your planning.

Get Started
Print 50 brochures for $57.11 in 3 business days
Standard Brochures run on 100# Gloss Text, 100# Silk Matte Text, or 70# Uncoated Text. Standard Rack Cards start at 50 for $42.84.
Legal Disclaimer
Gold Standard guarantees apply to all standard orders placed through 4over4.com. Price match requires verifiable proof of a competitor's published price for an equivalent product with matching specifications and turnaround time. Satisfaction guarantee covers manufacturing defects and print quality issues. Contact support with order number and documentation. On-time delivery rate based on tracked orders 1999 to 2026. Individual results may vary based on shipping carrier performance.
Explore more
Content marketing data, print benchmarks, and brochure products
 Statistics Small Business Statistics The hub that connects marketing spend to real growth.
  Statistics SMB Marketing Data How the small business channel mix is shifting year over year.
  Statistics Marketing Budget Benchmarks How much to spend on content, split by revenue and channel.
  Statistics Startup Statistics What new businesses spend on content, and where they waste money.
  Statistics Customer Retention Data Why keeping a customer costs far less than winning a new one.
  Statistics Referral Marketing Data One of the highest-return channels content can feed.
  Statistics Brand Loyalty Data What drives repeat business and long-term awareness.
  Product Brochures The printed content piece that closes deals in the hand.
  Product Business Cards The tangible touchpoint every content strategy needs. FAQs Printing FAQs Answers on stock, sizes, proofs, and turnaround times.
 Questions and answers
Common questions about content marketing data and trends
B2B, B2C, ROI, growth, visual content, and print, answered.
What are the most important content marketing statistics to track?
The most important content marketing statistics depend on your goals. For awareness, track website traffic and social engagement. For lead generation, monitor conversion rates and cost per lead. For ROI, measure revenue attributed to content efforts. B2B content marketing statistics tend to focus on lead quality, while B2C metrics lean toward engagement volume and brand recall. Browse the full small business statistics hub to see how these numbers connect.
How do B2B content marketing statistics differ from B2C?
B2B content marketing statistics show longer sales cycles, heavier reliance on educational content like whitepapers and case studies, and email as the primary distribution channel. B2C content marketing statistics focus on visual formats, shorter engagement windows, and social media as the dominant channel. Both benefit from adding print materials at key conversion points, where a physical piece cuts through the noise.
Is content marketing still growing in 2026?
Yes. Content marketing growth statistics project the industry will surpass 100 billion dollars in global revenue by 2026, and companies across every sector keep increasing their content budgets. The growth is driven by demand for video, personalized content experiences, and integrated campaigns that combine digital with physical touchpoints like printed marketing materials.
What ROI can you expect from content marketing?
Content marketing ROI statistics indicate that content marketing generates roughly three times more leads than traditional outbound marketing at 62 percent lower cost, according to DemandMetric. Actual ROI varies by industry, content quality, and distribution strategy. Companies with documented content strategies and multi-channel approaches that include print report the strongest returns.
How do visual content marketing statistics compare to text-based content?
Visual content marketing statistics show that image and video content consistently outperform text-only formats on engagement. Posts with visuals receive far more shares and interactions, while long-form written content still drives the most organic search traffic. The best approach combines both, visual content for social engagement and written content for search, supported by printed visual materials for offline impact.
How does print fit into a content marketing strategy?
Print materials act as physical content that reinforces your digital message. Campaigns that combine digital content with direct mail see higher response rates than digital-only efforts. Printed business cards, brochures, postcards, and branded packaging extend your content strategy into the real world, where tactile engagement creates stronger recall than screen-based interaction. Order Free Samples to feel the stocks before you commit.
