
Small Business Marketing Budget Statistics & Benchmarks


What small businesses actually spend on marketing, how they split it across print and digital, and where the smartest operators put their money, set against 25 plus years of order data at 4OVER4.
Most small businesses spend 5 to 10 percent of revenue on marketing, and 10 to 20 percent of that goes to print. The SBA points firms under $5 million toward 7 to 8 percent. What separates the winners is not the biggest budget, it is smart allocation, and print materials keep earning their place because a piece people can hold gets acted on.

Budget benchmarks
What small business owners actually spend on marketing
Small business marketing budget statistics tell a clear story. Companies that invest strategically outperform those that do not, but strategic does not mean spending the most. It means knowing where your dollars go furthest. The SBA points businesses under $5 million toward 7 to 8 percent of gross revenue, and most small firms land between 5 and 10 percent. 4OVER4.COM has helped 150,000 plus businesses stretch those dollars with print that delivers measurable returns, and you can test the quality yourself with Free Samples before you commit a cent of budget.

By the numbers
Small business marketing spend at a glance
Here are the headline figures owners reach for first when they plan a budget, drawn from SBA guidance, Data and Marketing Association reports, and our own production data. Percentages spell out the guideline, but the response-rate gap between print and email is where the money actually turns, so set both against 25 plus years of printing marketing materials at 4OVER4.COM.
Why it matters
Why small business marketing budget data matters
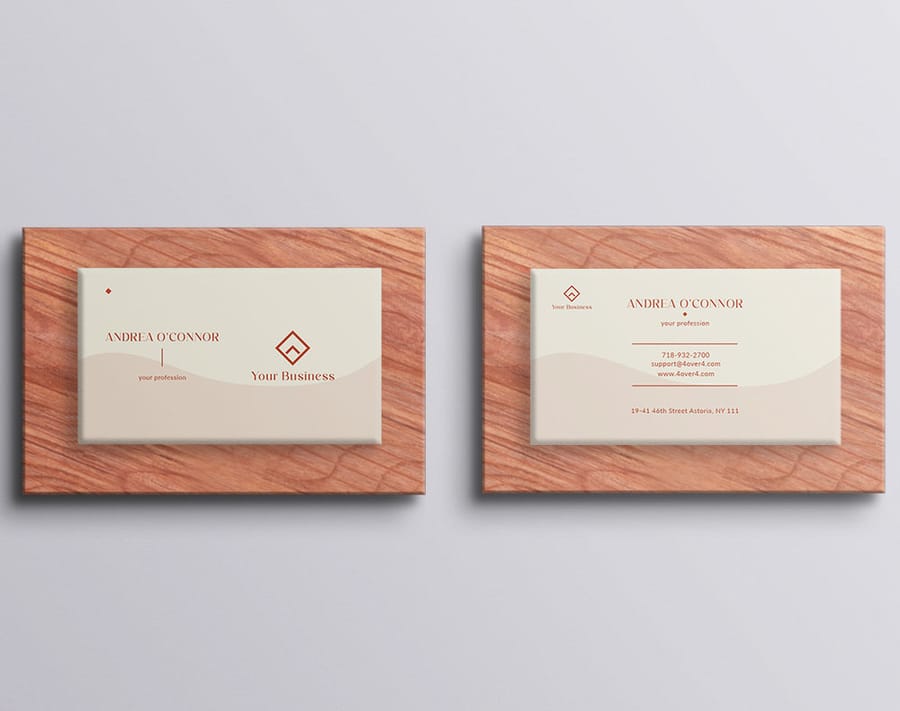
Your small business marketing budget decides how fast you grow, how many customers find you, and whether your brand sticks in people's minds. The U.S. Small Business Administration points businesses under $5 million in revenue toward 7 to 8 percent of gross revenue for marketing. In practice most small firms land between 5 and 10 percent, depending on industry and growth stage.
Averages hide a lot of variation. A local bakery spending $500 a month on flyers and social posts looks nothing like a software startup burning $15,000 a month on paid ads. What matters more than the percentage is where the money goes, and that is where the numbers get interesting. For the wider view, our Small Business Marketing Statistics page sets the context.
Tie those figures to real outcomes and the story sharpens. Our Small Business Growth benchmarks show how steady marketing investment lines up with the businesses that keep expanding year after year.
The benchmark
How much do small businesses spend on marketing?

The typical marketing budget for a small business runs between 5 and 10 percent of total revenue. Businesses earning under $1 million a year often push higher, sometimes 10 to 12 percent, because they are still building awareness. Companies between $1 million and $5 million tend to settle into the 7 to 8 percent range.
Once a business crosses $10 million, marketing budgets often ease to 5 or 6 percent because brand recognition carries part of the load. The takeaway is simple. Early-stage businesses need to invest more aggressively to get noticed at all.
If you are just getting off the ground, our Startup Statistics cover the spending patterns that separate the survivors from the businesses that never gain traction.
We started with just $300 a month for marketing. Business cards, door hangers, and a Google listing. That $300 brought in more clients than the $1,200 we were spending on social ads.
Derek L., landscaping company owner
Print versus digital
Print marketing ROI compared to digital channels
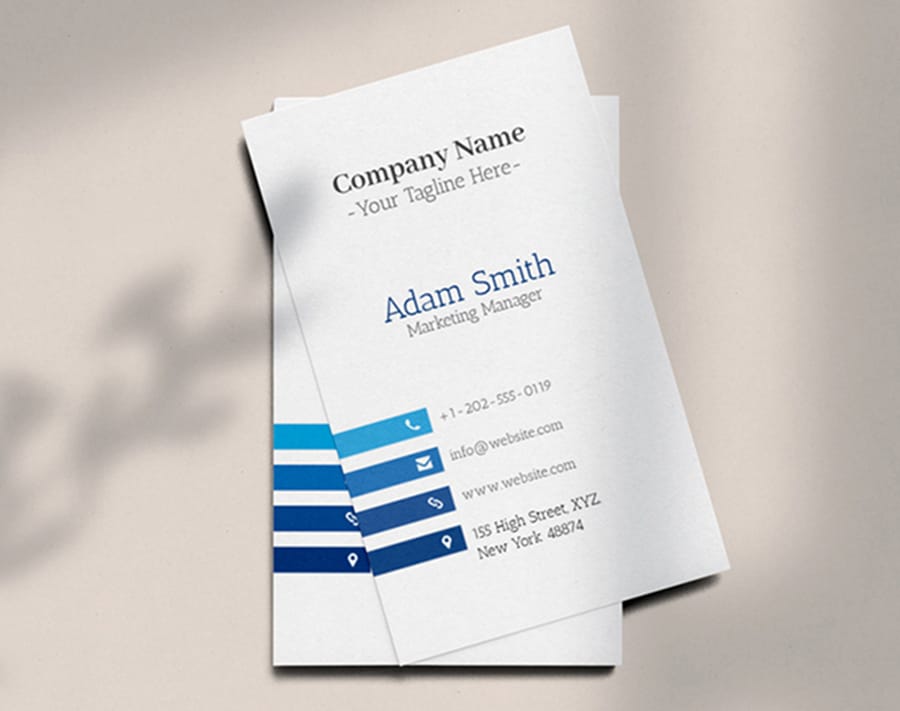
Here is where the budget conversation gets practical. Direct mail campaigns average a 4.4 percent response rate according to the Data and Marketing Association. Email marketing averages 0.12 percent. That is not a small gap, it is a canyon.
Cost per acquisition tells the same story. A well-targeted postcard campaign can bring in customers at 20 to 40 dollars each, while paid social in competitive local markets often runs 50 to 100 dollars or more per lead. For businesses watching every dollar, print punches well above its weight.
These numbers matter most when you look at the Small Business Failure Rate data. Underspending on marketing is one of the top reasons businesses close within five years.
Do more with less
How to stretch a tight marketing budget
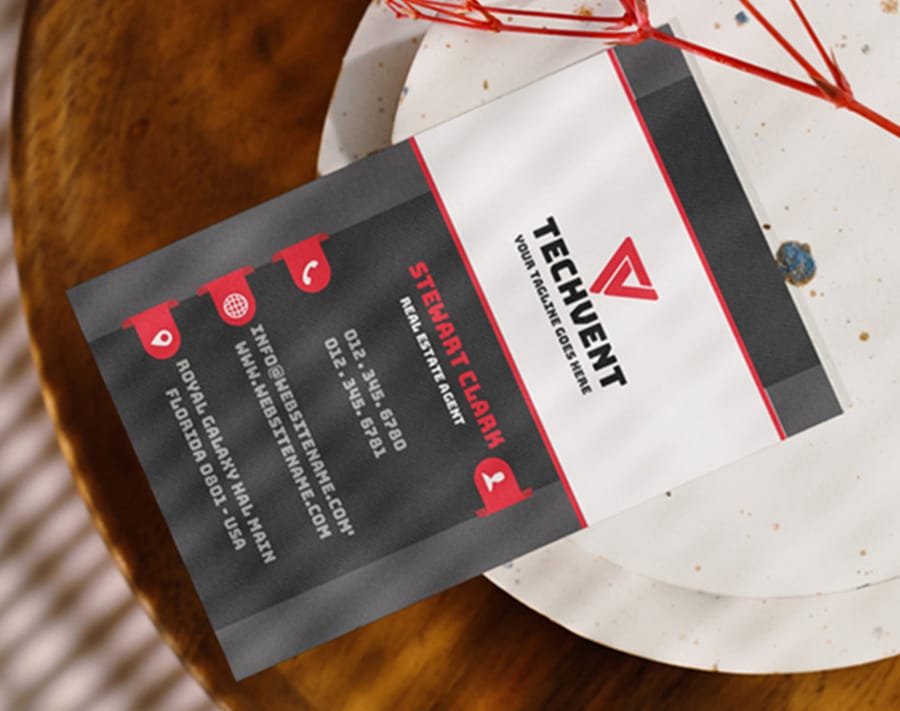
You do not need a massive budget to market well. You need smart allocation. Start with business cards. They cost pennies each and work around the clock. Hand one to someone and your brand lives in their wallet.
Invest in repeat-purchase tools next. Loyalty cards, referral cards, and thank-you inserts cost almost nothing and drive real repeat business. Order in bulk when you can, because per-unit costs drop fast at higher quantities.
Test before you scale. Run a small postcard batch to 500 addresses before mailing 5,000, measure the response, then put more money behind what works. When you are ready, business cards are the cheapest place to start.
Our order data
What our order data reveals about marketing spend

After 25 plus years serving 150,000 plus businesses, 4OVER4.COM has a clear view of how marketing budgets turn into real print orders. Businesses that reorder within 90 days of a first order tend to be the ones still trading three years later.
The most popular first order is business cards. The most popular reorder is postcards. That progression makes sense. You start with identity, who you are, then move to outreach, here is what you offer. It is a marketing funnel built in print.
Consistent spending, even in small amounts, lines up strongly with business longevity. For the full picture across the category, our Small Business Statistics hub pulls every benchmark together.
I almost cut our print budget last year to save money. Instead I switched to 4OVER4.COM for our postcards and business cards. Spent 30 percent less and the quality was actually better than our old printer.
Maria C., boutique owner
Where it goes
How small businesses allocate marketing dollars
Digital gets the headlines, but the real breakdown tells a different story. The split below reflects common allocation ranges, and print holds its share year after year because it works differently than a banner ad. Your ideal mix depends on your industry, your goals, and whether you are in growth mode or maintenance mode.
| Channel | Share of budget |
|---|---|
| Digital advertising | Paid search and social ads take 25 to 35 percent of the total marketing budget. |
| Website and SEO | Search visibility and site upkeep run 15 to 20 percent of budget. |
| Print marketing | Business cards, postcards, flyers, and banners hold 10 to 20 percent. |
| Social media | Ongoing management and content sit at 10 to 15 percent. |
| Email marketing | List tools and sends take a lean 5 to 10 percent. |
| Events and networking | Local events and sponsorships range from 5 to 15 percent. |
| Industry | How they use print |
|---|---|
| Real estate | Cards, just-listed postcards, and door hangers eat 15 to 25 percent of spend. |
| Restaurants | Menus, table tents, loyalty cards, and flyers run 10 to 15 percent. |
| Professional services | Premium cards and stationery signal credibility at 10 to 20 percent. |
| Retail and e-commerce | Packaging inserts and thank-you cards drive repeat sales at 5 to 15 percent. |
| Health and wellness | Appointment cards, brochures, and rack cards stay steady at 10 to 15 percent. |
Industry shapes the mix in a big way, and geographic relevance is the common thread. For family-focused promotions and community events, even Kids Printing products can stretch a budget in ways owners rarely expect.
Side by side
How print stacks up against other channels
Marketing budget statistics get most useful when you compare channels head to head. Owners do not operate in a vacuum, and every dollar has to compete for the best return. The comparison below puts print in context alongside paid media, email, and search.
| Channel | Typical cost | Response signal | Where it fits |
|---|---|---|---|
| Print marketing | Higher per piece | Direct mail near 4.4% response | Trust, recall, local reach |
| Paid search and social | Cost per click or lead | Fast, but easy to scroll past | Quick reach and testing |
| Very low per send | About 0.12% response | Nurturing an existing list | |
| SEO and website | Ongoing investment | Compounds slowly over time | Long-term discovery |
Print wins on trust, response, and memorability. Digital wins on speed and cost per impression. The smartest owners do not pick one or the other, they use both. A postcard that drives someone to a landing page combines the strengths of each.
The right budget allocation is not about following a formula. It is about matching your spending to your customer acquisition goals, then tracking what actually brings people through the door.
Myths vs facts
What owners get wrong about sizing a marketing budget
A few myths keep owners from spending in ways that would pay off. The pairs below set each common assumption against what the data actually shows, so you can build your budget on evidence rather than habit.
Spending the most on marketing wins.
What matters is where the money goes. Smart allocation across a few high-ROI channels beats a big budget spread thin.
Print marketing is outdated and not worth a line in the budget.
Print holds 10 to 20 percent of most small business budgets because a physical piece builds trust and recall that digital ads cannot.
You need a big budget to market effectively.
Business cards cost pennies each and work around the clock, and loyalty and referral cards drive repeat business for almost nothing.
Cutting marketing in a slow month saves money.
Businesses that cut during downturns take 3 to 5 years to recover their position, while steady spending grows faster when conditions improve.
Wally turns the budget into your next order
Benchmarks are step one. The piece is step two.
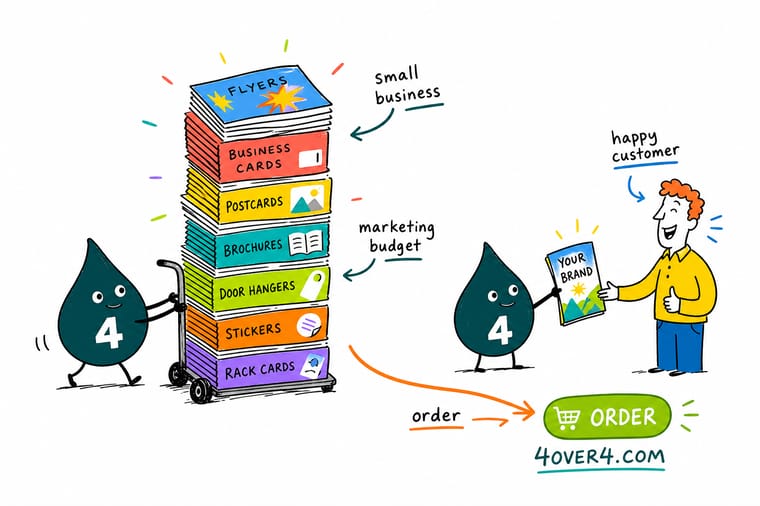
The numbers all point the same way. Smart allocation beats the biggest budget, and a physical piece in someone's hands beats a message lost in their inbox. Wally's rule is simple. Start with business cards because they cost pennies and work around the clock, add postcards as your first reorder, and let steady spending compound. That is how a tight budget turns into customers through the door.
Order business cards →Stock, finish and price
Card and rack card prices to slot into a budget
For owners ready to act on these numbers, here is current pricing for Business Cards, the lowest-cost marketing tool that works around the clock, alongside the full specifications so you can match the right stock and finish to your budget.
| Quantity | Price Per Unit | Total |
|---|---|---|
| 100 | 17.6¢ | $17.57 |
| 200 | 11.5¢ | $23.07 |
| 300 | 9.15¢ | $27.46 |
| 400 | 7.96¢ | $31.86 |
| 500 | 7.25¢ | $36.26 |
| 600 | 6.77¢ | $40.64 |
| 700 | 6.43¢ | $45.04 |
| 800 | 6.18¢ | $49.43 |

Want to feel the stock before you spend a dollar? Order Free Business Cards and see the print quality firsthand.
Start from a blank
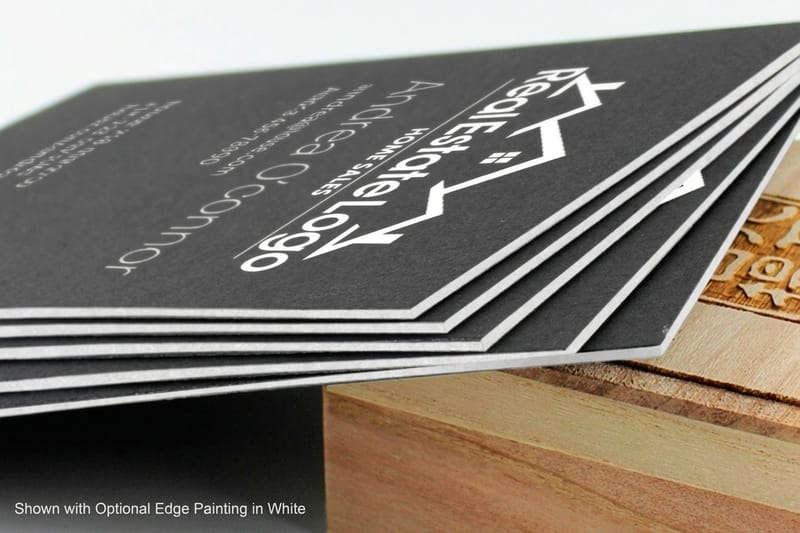
Blank templates for small business cards
Need a head start on design? These blank templates make it easy to get print-ready artwork, with bleed and safe margins already built in.

Print it
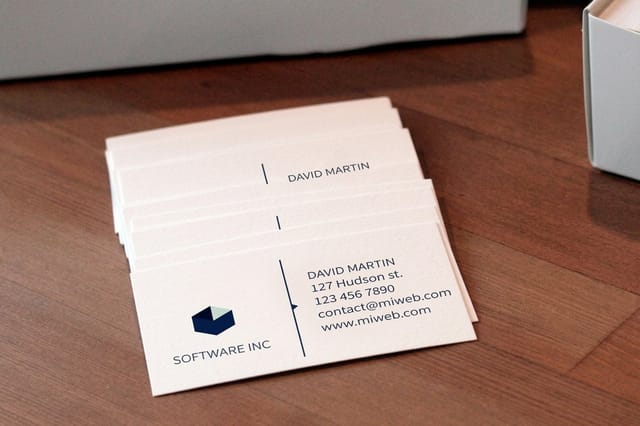
The products small businesses reach for most
Knowing the budget benchmarks is step one. Putting them to work is step two, and it starts with the right piece. Here are the products owners reach for most when they turn these numbers into a campaign.





Proof, not promises
What our order data shows about small budget print runs
Here are the quality and delivery signals that round out the picture for owners planning budgets in 2026 and beyond. A 99.8 percent on-time delivery rate keeps your campaigns on schedule, and a 4.8 out of 5 average across 10,000 plus reviews shows the print quality holds up order after order.
Why owners trust us
The printing record behind these budget benchmarks
Every benchmark on this page sits on a long record of getting print right. A 4.8 out of 5 average across 10,000 plus reviews, 150,000 plus businesses served, and marketing materials printed since 1999 are the trust signals behind the numbers, so you can plan a budget knowing the pieces will land sharp and on time.
How we built this
How we compiled this marketing budget data
The statistics on this page draw from U.S. Small Business Administration guidelines, Data and Marketing Association reports, and industry benchmarking studies. 4OVER4.COM internal order data reflects patterns across 150,000 plus business customers over 25 plus years of operation. All percentage ranges represent commonly cited benchmarks rather than proprietary survey results, and we update this page as new data becomes available.

Get Started
Print the first piece of that budget: 100 cards for $17.57
Start with the piece that carries the highest return per dollar, drop in your design or a free template, and we will print it sharp on premium stock and ship it on time.
Legal Disclaimer
Gold Standard guarantees apply to all standard orders placed through 4over4.com. Price match requires verifiable proof of a competitor's published price for an equivalent product with matching specifications and turnaround time. Satisfaction guarantee covers manufacturing defects and print quality issues. Contact support with order number and documentation. On-time delivery rate based on tracked orders 1999 to 2026. Individual results may vary based on shipping carrier performance.
Explore more
Budget benchmarks, marketing data, and print price lists
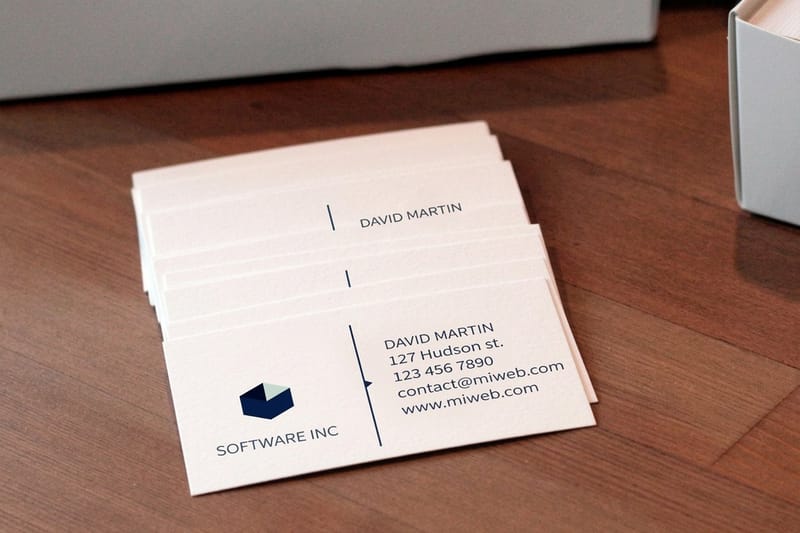 Product Business Cards The lowest-cost marketing tool that works around the clock.
  Product Postcards The most popular reorder for local outreach and offers.
  Statistics Small Business Marketing The broader trends behind where the budget goes.
  Statistics Small Business Growth Growth benchmarks that tie back to marketing spend.
  Statistics Startup Statistics Spending patterns that separate survivors from the rest.
  Statistics Failure Rate Data Why underspending on marketing closes doors.
  Hub Small Business Statistics The full hub of small business data and benchmarks. FAQs Printing FAQs Answers on stock, sizes, proofs, and turnaround.
 Questions and answers
Common questions about small business marketing budgets
Percentages, averages, print spend, ROI tracking, and samples, answered.
What percentage of revenue should a small business spend on marketing?
The U.S. Small Business Administration recommends 7 to 8 percent of gross revenue for businesses under $5 million. Newer businesses building brand awareness often spend 10 to 12 percent. The right marketing budget for a small business depends on your growth goals, your industry, and how established your brand already is.
What is the average marketing budget for small business owners?
Most small businesses spend between $5,000 and $50,000 a year on marketing. Businesses under $500,000 in revenue might spend $2,000 to $5,000. The average scales with revenue, but consistency matters more than total spend, because regular smaller investments outperform occasional large campaigns.
How much should I budget for print marketing specifically?
Print marketing typically represents 10 to 20 percent of a small business marketing budget. For a business spending $20,000 a year, that is $2,000 to $4,000 on business cards, postcards, flyers, and other printed materials. Print delivers strong ROI, with direct mail response rates near 4.4 percent against email at 0.12 percent.
Is print marketing still worth including in my budget?
Yes. Print creates physical touchpoints that digital channels cannot replicate. Business cards, postcards, and branded materials build trust and recognition in ways online ads do not. Order Free Business Cards from 4OVER4.COM and see how premium print feels in your hands before you commit.
How do I track ROI on my small business marketing budget?
Use unique phone numbers, QR codes, or promo codes on print materials to track responses. For digital channels, UTM parameters and conversion tracking handle measurement. Compare cost per acquisition across channels every month. The numbers that matter most are the ones specific to your business and your customers.
Should I increase my marketing budget when business is slow?
Yes. Businesses that maintain or increase marketing spend during slow periods recover faster than those that cut. Reducing your budget saves money short-term but costs you market position that takes years to rebuild. Even shifting to lower-cost channels like postcards and door hangers keeps your brand visible. Order Free Samples to test a format first.
