
Small Business Statistics That Shape 2026 Strategy


Growth, revenue, failure, and success benchmarks for 2026, set against the order data behind 25 plus years of printing for small businesses at 4OVER4.
Small businesses are 99.9 percent of US firms and employ nearly half the private workforce. Roughly 33.2 million operate today, about 81 percent with no employees. Around 1 in 5 close in year one and half by year five, usually after running out of cash. The owners who beat those odds reinvest in marketing and a professional brand, which is exactly where a printed first impression earns its keep.

In brief
What the growth data says about running a small business
Small business statistics tell a clear story. Companies with fewer than 500 employees run most of the US economy, making up roughly 99.9 percent of all firms and employing nearly half of the private workforce. 4OVER4.COM has served 150,000 plus businesses since 1999, and the patterns we see across our own customers mirror the national data closely. For a side hustle and a scaling company alike, a custom project can be sized to your stage of growth.
By the numbers
Small business America at a glance
Here are the headline figures owners reach for first when they plan a year, drawn from federal data and our own production records. Small businesses are not a niche. They are 33.2 million strong, they employ 61.7 million people, and the gap between solo operators and employer firms explains most of what growth and revenue statistics reveal.

Why the data matters
Why Small Business Data Matters More Than Ever
Small business statistics are more than numbers on a page. They are the foundation for every call an owner makes, from the first hire to the size of a marketing budget. The US Census Bureau reports that new business applications have hit record highs in recent years, so competition is fierce and the margin for error stays thin.
The data also tells some hard truths. Roughly 20 percent of new businesses do not survive their first year, and that number climbs as time goes on. Knowing the benchmarks lets you plan realistically instead of hoping for the best. For a closer look at where marketing dollars go, see our small business marketing statistics, and to understand why companies close, our small business failure rate breakdown puts the numbers in context.
How many are out there
How Many Small Businesses Operate in the US?

According to the US Small Business Administration, there are about 33.2 million small businesses in the country. They employ roughly 61.7 million people, close to half of the entire private workforce. That is not a niche segment, it is the backbone of the economy.
Most of these firms are very small. Around 81 percent have no employees at all. They are freelancers, consultants, solo operators, and side hustle owners. The other 19 percent employ between 1 and 499 workers. That mix matters, because growth does not always mean hiring. Sometimes it means more revenue per person, better margins, or a wider product line.
For a view of how new ventures fit into this picture, our startup statistics cover formation rates and early stage benchmarks in detail.
Revenue reality
Small Business Revenue by Industry

Revenue swings widely depending on what you sell and who you sell it to. The Census Bureau Annual Business Survey puts the median revenue for small businesses with employees near 1.1 million dollars a year, but that figure hides a lot of variation.
Professional services firms in accounting, law, and consulting tend to run lean with higher margins. Retail and food service often see higher gross revenue but tighter profit. Construction and manufacturing frequently report the highest total revenue while carrying the most overhead.
The starkest gap is between solo operators and employers. Non employer firms average around 50 thousand dollars in annual receipts, a world away from the 1.1 million median for employer firms. The takeaway is simple. Hiring your first employee is often the single biggest revenue inflection point a small business will hit.
We started as a two person shop and hit 800K in our second year. Going from solo to a small team changed everything about our revenue.
Verified customer, commercial cleaning owner
The failure numbers
Small Business Failure Statistics, Explained

Here is the uncomfortable part. Failure statistics get quoted constantly and just as often get misunderstood. Bureau of Labor Statistics data actually shows a steady pattern.
- About 20 percent fail within the first year. That is 1 in 5, not the bloodbath some people describe.
- Roughly 50 percent are gone by year five. This is where the real attrition happens, driven by cash flow trouble, market shifts, and owner burnout.
- About 65 percent close within 10 years. Only about a third make it to the decade mark.
These numbers have held remarkably steady for more than 25 years. Recessions make things worse for a while, but the long run pattern barely moves. What changes is the reason. Analyses of closures point to running out of cash, building something with no real market need, and getting outcompeted as the top three. For the full picture, our small business statistics hub ties these data points together.
Who grows
Small Business Growth Statistics

Growth statistics paint a brighter picture. Firms that survive their first five years grow revenue by an average of 20 to 30 percent from year five to year ten. That is not explosive Silicon Valley growth, but it is steady and sustainable, and the owners who hit those numbers tend to share a few habits.
- They reinvest in marketing. The SBA suggests 7 to 8 percent of gross revenue, though most spend far less. Our small business marketing budget data shows how firms actually allocate those dollars.
- They build brand recognition early. Business cards, signage, packaging, and printed materials create a professional image that earns trust.
- They track their numbers. Owners who review metrics monthly outperform those who check in once a quarter.
Employment tells a similar story. Small businesses created about 12.9 million net new jobs over the past 25 years, roughly two thirds of all net new private sector jobs, and firms with fewer than 20 employees drive the most hiring per company.
Our own data
What 4OVER4.COM Order Data Reveals

National data tells the macro story. Our own customer base fills in the detail. 4OVER4.COM has printed for 150,000 plus businesses over more than 25 years, and those orders carry their own set of small business statistics worth reading.
The most consistent pattern is this. Businesses that reorder printed materials within 90 days of a first order are far more likely to still be active two years later. That reorder behavior tracks closely with survival. Companies that invest in how they present their brand tend to be the ones that last.
We also see seasonal spikes that mirror the broader growth data. January and September run highest, lining up with New Year launches and fall marketing pushes, while closures cluster in the first quarter after a slow holiday season. The lesson is plain. Owners who prepare their marketing materials ahead of peak seasons outperform those who react after the fact.
Proof, not promises
What small businesses order from 4OVER4 as they grow
Here are the signals from our side of the press, the volume, reorder, and quality numbers that round out the picture for owners planning their next print run. A 99 percent reorder rate says the materials work, and 60 plus paper types mean you can match the right stock and finish to your budget.
Survival and industry mix
How survival and concentration break down
Small business statistics get most useful when you can compare them side by side. The survival curve drops most steeply between years one and five, then flattens. Industry concentration matters too, because you should only benchmark yourself against firms in your own vertical.
| Milestone | What the data shows |
|---|---|
| Year 1 | About 80 percent stay open, roughly 1 in 5 close |
| Year 5 | Around half remain, the steepest drop happens here |
| Year 10 | About 35 percent survive, and those firms tend to stabilize |
| Sector | Share of small firms |
|---|---|
| Professional and technical services | 17 percent of all small businesses |
| Construction | 12 percent of all small businesses |
| Retail trade | 10 percent of all small businesses |
| Health care and social assistance | 10 percent of all small businesses |
| Real estate | 8 percent of all small businesses |
These four sectors alone account for nearly half of all small businesses in the country. For a completely different angle on customer demographics and spending patterns, our kids printing collection shows how even niche markets benefit from tracking their own benchmarks.
Solo versus employer
How the numbers differ by firm size
The single biggest split in small business statistics is whether a firm has employees. That one line separates a 50 thousand dollar solo operation from a 1.1 million dollar employer, and it shapes revenue, growth, and financing access all at once.
| Metric | Non employer firm | Employer firm |
|---|---|---|
| Median annual revenue | About 50K dollars | About 1.1M dollars |
| Share of all firms | About 81 percent | About 19 percent |
| Financing approval odds | Lower, thin cash reserves | Higher, 80 percent plus once established |
| Main growth lever | More revenue per person | Hiring and new capacity |
Access to capital remains a defining factor. The Federal Reserve reports that about 43 percent of small businesses applied for financing in recent years, and roughly 76 percent received at least some of what they sought. Younger firms face the steepest odds, with approval rates near 50 percent compared to 80 percent plus for established businesses.
That funding gap is one reason failure rates run highest in the early years. Without cash reserves, a single bad month can be fatal, which is why lean spending on essentials like free business cards lets new owners reinvest the savings into growth.
Stock, finishing and price
Business card prices for a growing small business
For owners ready to act on these numbers, here is current pricing for standard business cards, the first impression that gets kept, alongside the full specifications so you can match the right stock and finish to your budget.
| Quantity | Price Per Unit | Total |
|---|---|---|
| 100 | 17.6¢ | $17.57 |
| 200 | 11.5¢ | $23.07 |
| 300 | 9.15¢ | $27.46 |
| 400 | 7.96¢ | $31.86 |
| 500 | 7.25¢ | $36.26 |
| 600 | 6.77¢ | $40.64 |
| 700 | 6.43¢ | $45.04 |
| 800 | 6.18¢ | $49.43 |

Wally turns the data into your next move
The statistics point one way. A strong first impression carries it.
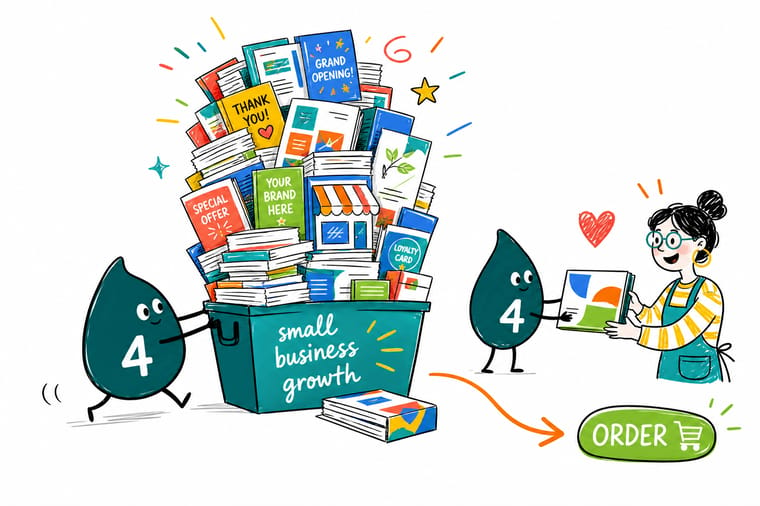
The numbers keep repeating the same lesson. Owners who invest in professional branding and consistent marketing materials grow faster and survive longer. Wally's rule is simple. Start with business cards people want to keep, reinvest the savings from free cards into your next print run, and let a professional first impression do the work every time you hand one over.
Order business cards →Start from a blank
Blank templates for your brand materials
Starting from scratch? These blank templates give you a clean, print ready canvas with bleed and safe margins already built in, so your first cards look professional out of the gate.
Print it
The products small businesses reach for most
Knowing the statistics is step one. Building a professional brand that customers trust is step two, and it starts with the right piece. Here are the products small business owners reach for most when they put these numbers to work.






Myths vs facts
Small business growth myths the survival data corrects
A few myths keep owners from moves that would pay off. The pairs below set each common assumption against what the small business statistics actually show, so you can plan on evidence rather than habit.
Most small businesses fail, so the odds are hopeless.
About 1 in 5 close in the first year, not the majority. Owners who watch cash flow weekly and validate demand early tend to beat the averages.
You need employees to count as a real small business.
Around 81 percent of US small businesses have no employees at all. Freelancers, consultants, and solo operators make up most of the economy base.
Printed materials are outdated for a modern small business.
Owners who invest in professional branding and print report higher customer retention, and a card that gets kept still brings in new clients.
Marketing is the first thing to cut when money is tight.
The SBA suggests 7 to 8 percent of revenue for marketing, and firms that keep spending through slow periods tend to grow faster.
Where the money goes
Marketing spend is a growth lever
The growth data keeps pointing at one habit. Firms that fund marketing consistently, especially branding and print, tend to grow faster and reorder more often than those that treat it as optional.
Why owners trust us
The print record behind these small business growth figures
Every benchmark on this page sits on a long record of getting print right. 150,000 plus businesses served, printing since 1999, and a 99 percent reorder rate are the trust signals behind the numbers, so you can plan your next run knowing the pieces will land sharp and on time.
How we built this
Where this data comes from
The small business statistics on this page come from federal sources including the US Small Business Administration, the Bureau of Labor Statistics, the US Census Bureau, and the Federal Reserve Small Business Credit Survey, along with industry research from the National Federation of Independent Business. 4OVER4.COM internal figures reflect order patterns from 150,000 plus business customers over more than 25 years. All numbers reference the most recent data available at the time of writing.
Free to customize
Free business card templates for small businesses
To put these numbers into action, here are design templates built for small business owners. Open any one in the online designer, swap in your details, and send it to print.

Get Started
Put these small business statistics to work
Pick a business card or marketing piece, drop in your design or a free template, and we will print it sharp on premium stock and ship it on time.
Legal Disclaimer
Gold Standard guarantees apply to all standard orders placed through 4over4.com. Price match requires verifiable proof of a competitor's published price for an equivalent product with matching specifications and turnaround time. Satisfaction guarantee covers manufacturing defects and print quality issues. Contact support with order number and documentation. On-time delivery rate based on tracked orders 1999 to 2026. Individual results may vary based on shipping carrier performance.
Explore more
More for growing small businesses: guides, products, and reviews
 Statistics Small Business Statistics Hub The full landscape of small business data in one place.
  Statistics Marketing Statistics Where small businesses spend to win attention.
  Statistics Failure Rate Data Why companies close and how to beat the odds.
  Statistics Marketing Budget Benchmarks How owners actually allocate their marketing dollars.
  Statistics Startup Statistics Formation rates and early stage benchmarks.
  Product Business Cards The first impression that gets kept, not tossed.
  Product Free Business Cards Launch your brand without a big upfront spend.
  Templates Blank Card Templates A clean, print ready canvas for your brand.
  Collection Kids Printing How niche markets benefit from their own benchmarks.
  FAQs Printing FAQs Answers on stock, sizes, proofs, and turnaround.
 Questions and answers
Common questions about small business data
Failure rates, revenue, jobs, industries, and profitability, answered.
What percentage of small businesses fail in the first year?
About 20 percent of small businesses close within their first year, according to Bureau of Labor Statistics data. That rate has stayed fairly steady for three decades, no matter the economy. The most common cause is running out of cash before the business reaches profitability.
How many small businesses are there in the United States?
The US Small Business Administration counts about 33.2 million small businesses, which is roughly 99.9 percent of all firms in the country. About 81 percent of them have no employees, so most are solo operators, freelancers, and independent contractors.
What is the average revenue for a small business?
It varies a lot by type. Employer firms report a median near 1.1 million dollars a year, according to Census data, while non employer firms average about 50 thousand dollars. Industry, location, and age all move these numbers. Our marketing budget benchmarks show how revenue turns into marketing spend.
What do growth statistics show about marketing investment?
The SBA suggests 7 to 8 percent of gross revenue for marketing. Growth data consistently shows that firms investing in professional branding and materials, including printed cards and brochures, grow faster than those that skip it. Consistent presentation builds trust and recognition.
How many jobs do small businesses create?
Small businesses have created about 12.9 million net new jobs over the past 25 years, roughly two thirds of all net new private sector jobs. Firms with fewer than 20 employees drive the most hiring per company, which makes them the largest collective employer in the economy.
What are the most common industries for small businesses?
SBA data shows the highest concentrations in professional and technical services at 17 percent, construction at 12 percent, retail trade at 10 percent, and health care at 10 percent. Real estate rounds out the top five near 8 percent.
What percentage of small businesses are profitable?
About 67 percent of small employer firms reported a profit in their most recent year, according to the Federal Reserve Small Business Credit Survey. Profitability tends to improve with age, so firms past the five year mark show noticeably higher profit rates. Want to check the print before you commit? Order free samples and hold the stock in your hand.
