
Small Business Marketing Statistics That Shape Strategy


Budgets, social media, websites, email, and print ROI, set against the order data behind 25 plus years of printing for 150,000 plus businesses.
Small business marketing statistics reveal where owners put their money and what actually works. Most allocate 7 to 12 percent of revenue to marketing, email returns 36 dollars for every 1 dollar spent, and 73 percent market on social media. Print still competes hard, with direct mail response rates that beat digital. Use these numbers, drawn from 150,000 plus businesses, to benchmark your own spend.
Where the money goes
What small business marketing statistics tell us
Small business marketing statistics are a roadmap, not just numbers on a page. Most owners put 7 to 12 percent of revenue into marketing, email returns roughly 36 dollars for every 1 dollar spent, and 73 percent market on social media. Print holds its ground too, with direct mail response rates that beat digital ad click-through by a wide margin. With 150,000 plus businesses trusting 4OVER4.COM for their printed materials, the data backs up what owners already feel. The numbers below help you benchmark your own spend, spot gaps, and decide where the next dollar should go.

By the numbers
Where small business marketing money actually goes
Here are the headline figures owners reach for first when they plan a marketing year, drawn from industry benchmarks and our own production data. Budgets cluster around 7 to 12 percent of revenue, email leads on ROI, and social media reaches most small businesses. Set those benchmarks against 25 plus years of printing marketing materials at 4OVER4.COM and the picture is consistent: the pieces people can hold get acted on.
Why it matters
Why these marketing numbers matter for your business
Small business marketing statistics are not just numbers on a page. They are a roadmap. When you know that most small businesses put 7 to 12 percent of revenue into marketing, you can benchmark your own budget against real-world data. When you see that print materials still drive measurable ROI, you stop guessing and start spending smarter.
This page pulls together the marketing statistics that matter most for small business owners across every channel, from digital and print to social and email. We have organized them by category so you can jump to what matters. For broader context on how small companies grow and scale, see our Small Business Growth data. And if you want to understand what happens when marketing falls short, our Small Business Failure Rate page makes the case for consistent spend.
Budget
Marketing budget allocation for small businesses

How much should you spend on marketing? That is the first question every owner asks. The answer depends on your industry, your growth stage, and your revenue, but the data gives clear benchmarks.
The U.S. Small Business Administration suggests businesses under 5 million dollars in revenue allocate 7 to 8 percent of gross revenue to marketing. Companies in growth mode often push that to 10 to 12 percent. The takeaway is simple. Underspending on marketing is one of the fastest ways to stall growth. For a deeper look at how budgets break down across industries, see our Small Business Marketing Budget data.
B2B companies tend to spend a smaller share of revenue on marketing than B2C businesses. But both groups are shifting more dollars toward digital channels while holding print budgets for high-touch customer moments. The split is not either or. It is both.
Digital
Digital marketing performance data

Digital marketing dominates the conversation, and the numbers back it up. Small businesses that invest in SEO, paid search, and content marketing report higher customer acquisition rates than those relying on word of mouth alone.
Google Ads returns an average of 2 dollars for every 1 dollar spent, and optimized campaigns often see much higher. Content marketing costs roughly 62 percent less than traditional outbound while generating about three times as many leads. The catch is time. SEO results usually take 4 to 6 months to compound, while paid ads deliver fast but stop the moment you stop paying.
Smart owners use both, paid for immediate traffic and organic for long-term growth. For founders building their first marketing mix, our Startup Statistics page covers how early-stage companies split resources across channels.
Social
Small business social media statistics
Social media is where small businesses punch above their weight. You do not need a huge budget to build a following. You need consistency and content that connects.
Roughly 73 percent of small businesses invest in social media marketing. Facebook remains the most-used platform, followed by Instagram and LinkedIn, and TikTok adoption has grown fast for consumer-facing brands. The average small business posts 3 to 5 times a week, and the best performers mix promotion with education and behind-the-scenes posts. The 80/20 rule still holds, 80 percent value and 20 percent promotion.
Video is the multiplier. Short-form video under 60 seconds generates far more shares than text and images combined, and it performs best on Instagram Reels and TikTok. If you are not making video yet, you are leaving engagement on the table.
We started posting short videos of our printing process on Instagram and saw our engagement triple in two months. People love watching things get made.
Verified customer, print shop owner and 4OVER4.COM customer
Websites
Small business website statistics
Your website is your digital storefront, and small business website statistics show how much rides on getting it right.
About 36 percent of small businesses still do not have a website, which is a major missed opportunity. Among those that do, mobile traffic accounts for over 60 percent of visits, so a site that is not mobile-ready loses more than half its audience before the offer is even seen.
Speed matters too. More than half of mobile users abandon a site that takes longer than 3 seconds to load, and every extra second cuts conversions by roughly 7 percent. Landing pages with a single call to action convert better than pages with competing options. Treat your website as a conversion tool, not a digital brochure, and the results follow.
Print ROI
Print marketing ROI and effectiveness

Print is not dead. Not even close. The data tells a very different story than the everything-is-digital narrative.
Direct mail earns a 9 percent response rate for house lists and 4.9 percent for prospect lists. Set that against email average click-through rates near 1 percent and print looks very competitive for the right campaign. Print also has staying power. A business card sits on a desk for weeks, a postcard gets pinned to a fridge, and a brochure lives in a waiting room, while a digital ad vanishes the moment someone scrolls past.
4OVER4.COM has printed 10 billion plus cards for 150,000 plus businesses, and the reorder data tells the story. When 99 percent of customers come back, the materials are working. For a broader look at how small businesses perform across every metric, visit our Small Business Statistics hub.
We A/B tested digital ads against a direct mail postcard campaign for our grand opening. The postcards brought in three times more foot traffic. We have used print for every promotion since.
Verified customer, bakery owner
Order data
What 4OVER4 order data reveals about marketing
Third-party marketing statistics are valuable, but our own order data, drawn from 150,000 plus businesses since 1999, adds another layer. With 25 plus years of orders across 1,000 plus products, we see patterns industry reports miss.
Reorder rates tell the real story. When 99 percent of customers reorder, the marketing materials are doing their job. Business cards remain the most-ordered product, followed by postcards, flyers, and brochures, while the fastest-growing categories are stickers, labels, and signage that give small businesses physical brand presence.
Seasonal patterns are clear too. Q1 spikes with business card orders as companies refresh branding, and Q4 fills with holiday postcards and promotions. Smart businesses order ahead of these peaks to avoid rush fees, and 4OVER4.COM ships 82 percent of orders early with a 99.8 percent on-time delivery rate.
More channels
Email, content, and advertising benchmarks
Email marketing benchmarks
Email remains one of the highest-ROI channels available. The Data and Marketing Association reports an average return of 36 dollars for every 1 dollar spent, a number that has held for years. Average open rates for small business emails run 21 to 25 percent depending on industry, with click-through rates around 2.5 to 3 percent.
Segmented campaigns beat generic blasts by a wide margin, and personalized subject lines alone can lift open rates by 26 percent. The best campaigns mix promotional offers with genuinely useful content like how-to guides and customer spotlights. Build a list, segment it, and send consistently. That is the formula.
Content marketing and SEO
Small businesses that blog consistently get about 55 percent more website visitors than those that do not. Content marketing is a long game, but the compounding returns are hard to ignore. The average post that ranks on page one of Google runs over 1,400 words, though quality beats length. A tight 800-word post that answers a specific question outperforms a rambling 2,000-word piece every time.
Advertising spend trends
Small business advertising spend keeps shifting toward digital, but not as dramatically as headlines suggest. Small and medium businesses still put roughly 30 to 40 percent of their advertising budget into traditional channels including print, direct mail, and signage. The businesses seeing the best results are not choosing digital or traditional. They use both, so a social ad drives someone to the site, a follow-up postcard reinforces the message, and a business card at an event creates a physical touchpoint.
Side by side
How marketing channels stack up for small businesses
Comparing small business marketing statistics across channels helps you decide where to invest. Each channel has different strengths, costs, and timelines, and the right mix depends on your business type, audience, and goals. 4OVER4.COM helps 150,000 plus businesses execute the print side of their strategy, and the smartest customers pair print with digital for maximum impact.
When you read these benchmarks, remember that averages hide a lot of variation. A well-run email campaign beats a poor one by 10 times or more, and the same goes for print, social, and paid search. Even niche audiences respond to multi-channel approaches. Businesses selling to families often pair social with printed materials, and our Kids Printing collection shows how print connects with younger demographics through colorful, tactile pieces.
| Channel | Strength | Engagement | Cost |
|---|---|---|---|
| Highest ROI at $36 per $1 spent | 21 to 25 percent open rate | Very low per send | |
| Direct mail | 9 percent house-list response | Weeks of desk-side presence | Higher per piece |
| Social media | Used by 73 percent of small businesses | Short-form video drives shares | Low, time-intensive |
| Paid search | About $2 back for every $1 | Immediate, stops when paused | Pay per click |
| Content and SEO | 55 percent more site visitors | Compounds over 4 to 6 months | Time, not ad spend |
Proof, not promises
Marketing materials by the numbers at 4OVER4
Here are the signals from our side of the press, the volume, delivery, and quality numbers that round out the picture for owners planning campaigns in 2026 and beyond. A 99 percent reorder rate shows the marketing materials keep working, and a 99.8 percent on-time delivery rate keeps your launch dates on track.
Make it relevant
Where the marketing budget pays off fastest
Myths vs facts
What owners get wrong about marketing spend and print
A few myths keep owners from spending where the data points. The pairs below set each common assumption against what the marketing statistics actually show, so you can plan your next year on evidence rather than habit.
Print marketing is dead in a digital world.
Direct mail earns a 9 percent response rate for house lists, and business cards, postcards, and brochures create physical touchpoints digital cannot replicate.
Email is cheap, so it always beats other channels.
Email leads on ROI at 36 dollars per 1 dollar spent, but the best results come from pairing it with print, social, and search rather than relying on one channel.
You need a big budget to win on social media.
73 percent of small businesses market on social, and consistency plus short-form video beats spend. Video earns far more shares than text and images combined.
A website is optional for a small business.
36 percent of small businesses still lack a website, and over 60 percent of visits are mobile. A fast, mobile-ready site is table stakes, not a nice-to-have.
Wally turns the data into your next campaign
Statistics are only step one. The materials are step two.
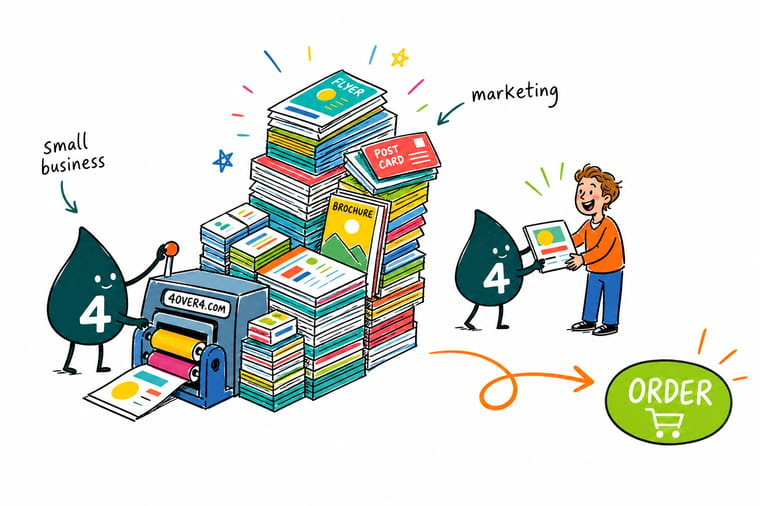
The pattern across the data is a spread budget plus one thing the customer can hold. Wally's rule is simple. Benchmark your spend near 7 to 12 percent of revenue, put email and social to work, and print the touchpoints that stick around. Standard Business Cards start at 100 for $17.57 and print in 3 business days, and 200 free business cards print in 5.
Order business cards →Stock, finishing and price
What a first card order costs at 100 and at 200
For owners ready to act on these numbers, here is current pricing for Business Cards, the most-ordered marketing material, alongside the full specifications so you can match the right stock and finish to your brand.
Start from a blank
Blank templates for marketing materials
Each template below already carries the trim, bleed, and safe margin lines for its product, so artwork lands where the cutter expects it.

Free templates
Ready made designs for cards, flyers, and postcards
Open any of these designs in the online designer, swap in your details, and print. Each one is built for small business branding.




Print it
The marketing materials owners reach for most
Knowing the marketing statistics is step one. Executing a campaign that actually hits those benchmarks is step two, and it starts with the right piece. Here are the products small businesses reach for most when they put these numbers to work.



Why owners trust us
Who prints for the 150,000 businesses in this data
Every benchmark on this page sits on a long record of getting marketing materials printed right. A 4.8 out of 5 average across 10,000 plus reviews, 150,000 plus businesses served, and print since 1999 are the trust signals behind the numbers, so you can plan a campaign knowing the pieces will land sharp and on time.
Turning stats into results
Turning marketing statistics into printed results
Small business marketing statistics point to one clear conclusion. Print materials still drive real results when quality is high and timing is right, and 4OVER4.COM makes both easy. Need materials fast? Same Day Printing gets your order produced and shipped within 24 hours, so your next campaign, event, or grand opening does not have to wait.
4OVER4.COM offers 60 plus paper types across 1,000 plus products, so you can match your materials to your brand. Every order is backed by our 5 Gold Guarantees covering quality, price match, on-time delivery, service, and satisfaction. The data shows multi-channel marketing wins, so pair your digital campaigns with printed touchpoints through Same Day Printing and give your audience something they can hold onto.
How we built this
How we gathered and verified this data
The small business marketing statistics on this page come from two sources, published industry research and 4OVER4.COM internal order data spanning 25 plus years. External figures are drawn from organizations like the U.S. Small Business Administration, HubSpot, Google, Hootsuite, and the Data and Marketing Association, each cited with its original source. Our own data, including the 150,000 plus businesses served and reorder rates, comes directly from our order management systems. We update this page as new research becomes available.

Get Started
Order 100 business cards for $17.57, printed in 3 business days
Standard Business Cards run from 14pt Gloss Cover to 24pt Ultra Thick. Standard Postcards start at 50 for $16.48 and flyers at 50 for $39.54.
Legal Disclaimer
Gold Standard guarantees apply to all standard orders placed through 4over4.com. Price match requires verifiable proof of a competitor's published price for an equivalent product with matching specifications and turnaround time. Satisfaction guarantee covers manufacturing defects and print quality issues. Contact support with order number and documentation. On-time delivery rate based on tracked orders 1999 to 2026. Individual results may vary based on shipping carrier performance.
Explore more
Small business marketing data, budget benchmarks, and print products
 Statistics Small Business Statistics The hub for how small companies grow, hire, and spend.
  Statistics Small Business Growth Benchmarks for how small companies scale year over year.
  Statistics Small Business Failure Rate Why consistent marketing spend keeps businesses alive.
  Statistics Marketing Budget Benchmarks How budgets break down across industries and stages.
  Statistics Startup Statistics How early-stage companies allocate across channels.
  Product Business Cards The most-ordered marketing material, printed sharp.
  Collection Kids Printing Colorful, tactile materials that connect with families.
  Guides Printing Guides Step-by-step help for every marketing print project.
  Samples Free Samples Feel the stocks and finishes before you commit. FAQs Printing FAQs Answers on stock, sizes, proofs, and turnaround.
 Questions and answers
Common questions about small business marketing data
Budgets, ROI, social, websites, and email, answered.
How much should a small business spend on marketing?
The U.S. Small Business Administration recommends 7 to 8 percent of gross revenue for businesses under 5 million dollars in revenue, and growth-stage companies often spend 10 to 12 percent. The right number depends on your industry, competition, and goals. The statistics consistently show that underspending on marketing correlates with slower growth.
What marketing channel has the highest ROI for small businesses?
Email marketing delivers the highest average ROI at 36 dollars for every 1 dollar spent, according to the Data and Marketing Association. Direct mail also performs well with response rates of 4.9 to 9 percent. The data shows that combining channels, from email and print to social and search, outperforms any single channel used alone.
Do small businesses still need print marketing?
Yes. Direct mail response rates outperform digital ad click-through rates by a wide margin. Business cards, postcards, and brochures create physical brand touchpoints that digital cannot replicate. 4OVER4.COM has printed 10 billion plus cards because print continues to drive measurable results across every industry. Order Free Samples to feel the difference before you commit.
What percentage of small businesses use social media marketing?
Roughly 73 percent of small businesses invest in social media marketing, according to Hootsuite. Facebook is the most popular platform, followed by Instagram and LinkedIn. Short-form video under 60 seconds generates the highest engagement across every platform, so it is the fastest way to grow reach on a small budget.
How important is a website for small business marketing?
A website is foundational. About 36 percent of small businesses still lack one, which is a serious disadvantage. Mobile traffic accounts for over 60 percent of visits, so a mobile-ready site is not optional, and pages that load in under 3 seconds keep far more visitors than slower competitors.
What is the average email open rate for small businesses?
Small business email open rates average 21 to 25 percent depending on industry. Segmented campaigns and personalized subject lines push that number higher. The best performers send consistently, at least 2 to 4 times a month, and mix promotional content with material their audience actually wants to read.
