
Customer Retention Statistics That Shape 2026 Strategy


Retention rates by industry, B2B benchmarks, acquisition-cost comparisons, and the print tactics that keep customers coming back, set against 25 plus years of order data at 4OVER4.
Keeping a customer costs a fraction of winning a new one, and the data proves it. Acquisition runs 5 to 25 times more expensive than retention, a 5 percent lift in retention can raise profits by 25 to 95 percent, and existing customers spend 31 percent more per order. With 150,000 plus businesses printing loyalty cards and thank-you mail at 4OVER4.COM, physical touchpoints keep buyers coming back.

The short version
What customer retention statistics tell us
Customer retention statistics paint a clear picture. Keeping your existing buyers is cheaper and more profitable than chasing new ones. Businesses that invest in retention, including tangible touchpoints like print marketing, see stronger lifetime value and lower churn. 4OVER4.COM has helped 150,000 plus businesses build lasting relationships through printed materials that keep brands top of mind. From loyalty cards to direct mail campaigns, the data shows physical pieces drive repeat purchases at rates digital-only strategies cannot match. Browse our design templates to start building retention-focused print campaigns today.

By the numbers
Four retention figures that change a budget
Here are the headline figures marketers reach for first when they plan a retention program, drawn from published research and our own production data. Acquisition costs run several times higher than retention, a small lift in retention drives an outsized jump in profit, and physical pieces keep buyers engaged where digital-only tactics fade. Set those benchmarks against 25 plus years of printing loyalty pieces at 4OVER4.COM and the pattern is consistent.
Why it matters
Why customer retention data matters for your business
Customer retention statistics are not just numbers on a spreadsheet. They are a roadmap for where to spend your marketing budget. The gap between acquisition costs and retention costs keeps growing, and smart businesses are paying attention. According to research from Bain and Company, increasing customer retention rates by just 5 percent can boost profits by 25 percent to 95 percent.
That is not a typo. Small improvements in how you keep customers coming back create outsized returns. For context, our broader small business growth statistics show how retention fits into overall growth patterns. Whether you are a startup or an established brand, these numbers should shape your strategy.
If you are looking for cost-effective ways to stay in front of customers, the daily deals at 4OVER4.COM make print-based retention campaigns affordable at any scale, from loyalty cards to thank-you postcards.
Industry breakdown
Customer retention rate by industry, the full breakdown
Customer retention rates vary widely depending on your industry. Media and professional services companies tend to hold onto customers at rates above 80 percent. Hospitality and restaurants often hover closer to 55 to 60 percent. Understanding where your industry falls on this spectrum helps you set realistic benchmarks and spot where you are underperforming.
The takeaway is straightforward. If your retention rate sits below your industry average, you are leaving money on the table. If you are above average, there is still room to grow. The businesses that dominate their markets do not just acquire customers, they keep them. For a deeper look at how marketing spend connects to these outcomes, explore our small business marketing statistics.
B2B versus B2C
B2B customer retention statistics versus B2C
B2B customer retention statistics tell a different story than their B2C counterparts. B2B companies typically see higher retention rates, often between 76 and 81 percent, because switching costs are higher and relationships run deeper. When a business commits to a vendor, there is onboarding, integration, and trust built over months or years.
B2C brands face a tougher fight. Consumer loyalty is fickle. One bad experience or one competitor coupon and they are gone. That is why B2C companies lean harder on emotional connection and brand recognition. Physical touchpoints like a handwritten thank-you card, a branded loyalty punch card, or a well-designed mailer create the kind of tactile memory that digital ads cannot replicate.
4OVER4.COM works with 150,000 plus businesses across both B2B and B2C, and we see firsthand how printed materials strengthen retention in both models. A B2B client sending premium branded folders to prospects builds credibility. A B2C bakery handing out loyalty cards builds habit.
Retention versus acquisition
Customer retention versus acquisition cost
Customer retention versus acquisition cost statistics make the case crystal clear. According to Harvard Business Review, acquiring a new customer costs anywhere from 5 to 25 times more than retaining an existing one. Think about that for a second. You could spend 100 dollars to win a new customer or 4 to 20 dollars to keep one you already have.
Yet most businesses still allocate the bulk of their marketing budget to acquisition. It is a trap. The flashy new campaign, the paid social ads, the influencer partnerships all drive new eyeballs. But without a retention strategy, those new customers churn out just as fast as they came in.
The math gets even more compelling when you factor in lifetime value. A retained customer does not just buy once more. They buy repeatedly, spend more per transaction over time, and refer others. That referral loop alone can cut your acquisition costs. Reviewing the small business failure rate data makes it clear that businesses which ignore retention often do not survive.
Print and retention
How print marketing drives customer retention
Here is where customer retention statistics intersect with something tangible. Direct mail has a response rate of around 4.4 percent compared to email at 0.12 percent, according to the Data and Marketing Association. That is not a marginal difference. That is a completely different ballgame.
Why does print work so well for retention. It is physical. It sits on a desk, sticks to a fridge, lives in a wallet. A well-designed postcard or thank-you card creates a moment of connection that a push notification never will. Your customers are drowning in digital noise, and a piece of mail cuts through it.
4OVER4.COM prints materials for businesses that understand this. Loyalty cards, referral cards, branded packaging inserts, and direct mail postcards are not old-school tactics. They are retention tools backed by data, and with 10,000 plus reviews at a 4.8 out of 5 rating, the quality of what you send reflects directly on your brand.
We started sending branded postcards to customers 30 days after their first purchase. Our repeat purchase rate jumped from 18 percent to 31 percent in six months. The cards cost pennies compared to what we were spending on retargeting ads.
Marcus L., e-commerce brand owner
Revenue impact
The revenue impact of retention

The financial case for retention goes beyond cost savings. Existing customers are 50 percent more likely to try new products from a brand they trust. They also spend 31 percent more per order compared to first-time buyers. Those numbers compound over time.
Consider a simple scenario. Say you have 1,000 customers. If you retain 10 percent more of them each year, and each retained customer spends just 50 dollars more annually, that is an extra 5,000 dollars in revenue. Scale that to 10,000 customers and you are looking at 50,000 dollars, with no new ad spend required.
This is why our startup statistics consistently show that the most successful early-stage companies prioritize retention from day one. They do not wait until they have a churn problem. They build retention into their DNA.
Email versus mail
Email versus direct mail for retention
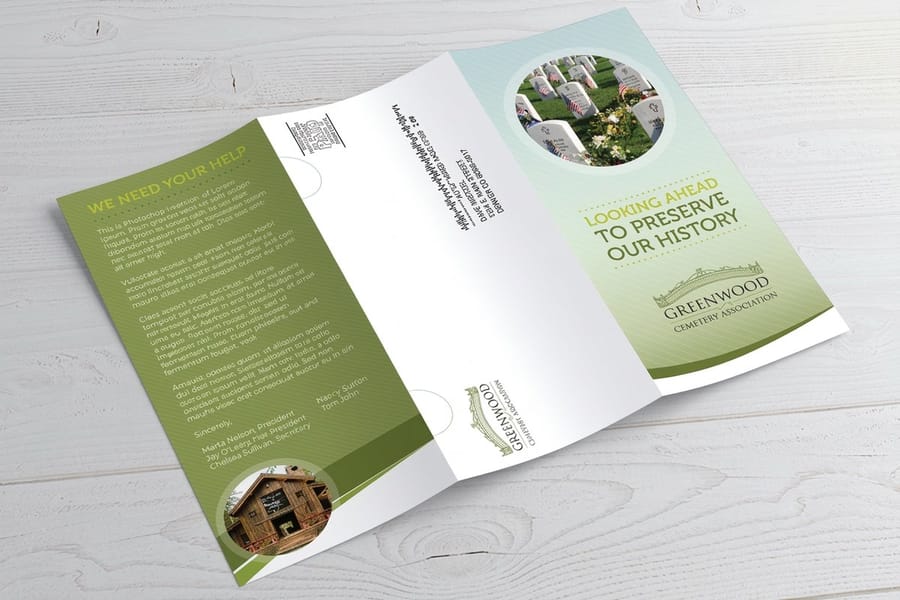
Do not get us wrong. Email marketing works for retention. But the data suggests it works better when paired with print. Email open rates average around 20 percent and click-through rates hover near 2.5 percent. Direct mail, by contrast, gets opened at rates above 90 percent because it is physically in your hands.
The smart play is not choosing one over the other. It is using both. Send an email campaign, then follow up with a printed postcard to non-openers. The multi-channel approach consistently outperforms single-channel strategies in retention metrics.
4OVER4.COM makes this easy with 99.8 percent on-time delivery and fast turnaround times. You can plan print campaigns alongside your digital calendar without worrying about delays throwing off your timing.
Our own data
What 4OVER4.COM order data reveals about retention
Here is something we do not talk about enough. 4OVER4.COM has printed over 10 billion cards for 150,000 plus businesses since 1999. That is 25 plus years of data on what businesses order, when they reorder, and what products they come back for. Our internal data shows that 99 percent of customers reorder, a retention rate that speaks to both product quality and the role print plays in daily operations.
Businesses that order loyalty cards, referral cards, and direct mail pieces reorder more frequently than those ordering one-off projects. That pattern aligns with broader customer retention statistics. The businesses investing in retention-focused print materials are the ones that keep coming back to us, because their own customers keep coming back to them. For more benchmarks, explore our small business statistics resource.

Industry benchmarks
How retention metrics stack up across key industries
Customer retention statistics become actionable when you can compare your performance against industry benchmarks. The differences between sectors are dramatic, and knowing where you stand helps you set realistic goals. Businesses that track their small business marketing budget alongside retention rates make smarter allocation decisions.
| Industry | Where retention lands |
|---|---|
| Media | Retention above 80 percent, among the stickiest sectors. |
| Professional services | High retention built on long contracts and deep ties. |
| SaaS and software | Above 80 percent when onboarding is strong. |
| Retail and e-commerce | Mid-range near 60 to 65 percent, loyalty programs help. |
| Hospitality and restaurants | Lower, closer to 55 to 60 percent, experience-driven. |
| Segment | What the data shows |
|---|---|
| B2B retention | Typically 76 to 81 percent, relationships run deep. |
| B2C retention | More volatile, one bad experience can lose a buyer. |
| B2B tactic that works | Premium branded folders and dimensional mailers. |
| B2C tactic that works | Loyalty cards, thank-you postcards, packaging inserts. |
What stands out is how much variation exists even within a single industry. A restaurant with a strong loyalty program might retain 70 percent of customers while a competitor down the street retains 45 percent. The tools and tactics matter as much as the industry you are in.
Loyalty programs
Loyalty programs and retention, what the data shows
Loyalty programs remain one of the most effective retention tools available. According to Bond Brand Loyalty, 79 percent of consumers say loyalty programs make them more likely to keep doing business with a brand. But here is the catch. The program has to feel valuable. Generic point systems that take forever to redeem do not cut it anymore.
The best-performing loyalty programs combine digital tracking with physical rewards. A punch card at a coffee shop. A VIP membership card that feels premium in the hand. A surprise discount postcard in the mail. These tangible elements make the loyalty experience feel real rather than transactional.
Our customers actually keep our loyalty cards in their wallets. We printed them on thick, durable stock through 4OVER4.COM, and people treat them like credit cards. That visibility alone drives repeat visits.
Verified customer, salon owner
Side by side
How retention tactics stack up
Retention statistics become most useful when you compare tactics against one another. Every dollar has to compete for the best return, so the comparison below puts loyalty cards and direct mail in context alongside email and retargeting ads.
| Tactic | Stickiness | Response and recall | Cost | Trackable |
|---|---|---|---|---|
| Loyalty cards | High, kept in the wallet | Repeat visits, strong recall | Low per card | Yes, with codes |
| Thank-you direct mail | High, lands on the desk | 4.4 percent response, high recall | Higher per piece | Yes, with QR and offers |
| Lower, easy to ignore | Around 20 percent open, low recall | Very low per send | Yes | |
| Retargeting ads | Low, scrolled past | Low intent, banner blindness | Cost per impression | Yes |
Physical tactics win on stickiness, response, and memorability. Digital wins on speed and cost per send. The smartest marketers do not pick one, they use both. A loyalty card that drives someone to a landing page combines the strengths of both channels.
For B2B retention specifically, the gap widens. Decision-makers are harder to reach through digital channels because of spam filters and inbox fatigue. A physical piece on the desk bypasses all of that.
Myths vs facts
What gets assumed about repeat buyers, and what holds
A few myths keep businesses from investing in retention that would pay off. The pairs below set each common assumption against what the customer retention statistics actually show, so you can plan on evidence rather than habit.
New customers matter more than existing ones.
Acquiring a customer costs 5 to 25 times more than keeping one, and existing buyers spend 31 percent more per order.
Retention is only about discounts.
Consistent, meaningful touchpoints drive loyalty, from thank-you cards to referral cards, not just price cuts.
Digital-only is enough to keep customers.
Physical touchpoints like loyalty cards and direct mail create tactile memory that digital ads cannot replicate.
Loyalty programs do not move the needle.
79 percent of consumers say loyalty programs make them more likely to keep buying from a brand.
Wally turns retention data into repeat customers
Keeping a customer costs a fraction of winning a new one.
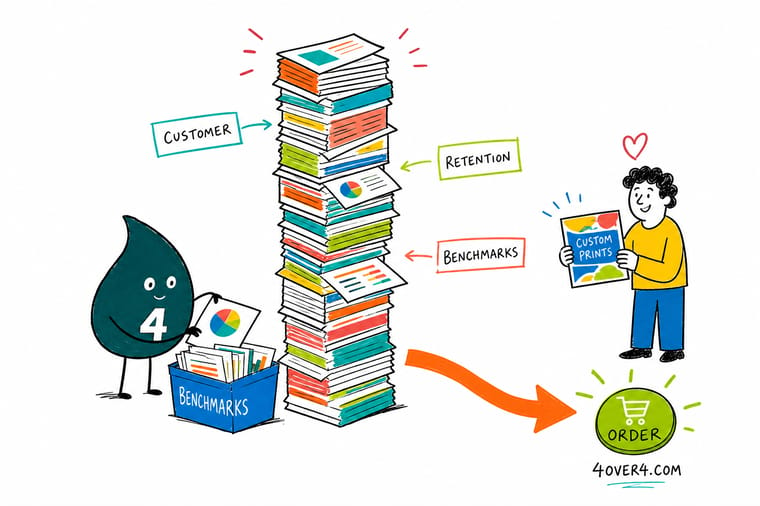
The numbers all point one way. A retained customer spends more, buys more often, and refers others, while costing 5 to 25 times less than a new one. Wally's rule is simple. Give people a reason to come back and a physical reminder to do it, from a loyalty card to a thank-you postcard, then let repeat purchases compound. A mailed postcard returns 4.4 percent against 0.12 percent for email, and aimed at customers who already spend 31 percent more per order, that gap is where the 5 percent retention lift comes from.
Order postcards →Experience and retention
Customer experience and retention, the connection
According to PwC, 73 percent of consumers say customer experience is a deciding factor in their purchasing decisions, and 32 percent will walk away from a brand they love after just one bad experience. Retention is not just about marketing. It is about every touchpoint.
That includes the physical touchpoints. The quality of your business card at a meeting. The feel of your packaging when an order arrives. The design of your thank-you card. These moments shape perception, and perception drives retention.
I switched to 4OVER4.COM for our branded packaging inserts and the feedback from customers was immediate. People started posting unboxing videos. Our return customer rate went up 22 percent in one quarter.
Verified customer, DTC brand founder
Stock, finishing and price
Loyalty postcard pricing and specifications
For businesses ready to act on these numbers, here is current pricing for Postcards, the retention format with the highest response per dollar, alongside the full specifications so you can match the right stock and finish to your loyalty campaign.
| Quantity | Price Per Unit | Total |
|---|---|---|
| 50 | 33.0¢ | $16.48 |
| 100 | 24.2¢ | $24.16 |
| 200 | 15.9¢ | $31.86 |
| 300 | 12.8¢ | $38.45 |
| 400 | 11.3¢ | $45.04 |
| 500 | 10.3¢ | $51.62 |
| 600 | 9.89¢ | $59.31 |
| 700 | 9.57¢ | $67.00 |

Start from a blank
Blank templates for retention print pieces
Need a head start on design? These blank templates make it easy to get your retention artwork print-ready, with bleed and safe margins already built in.
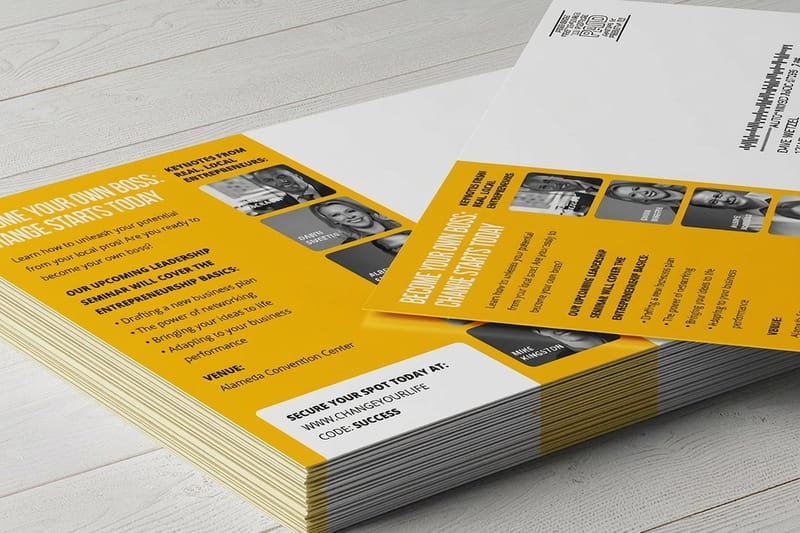
Proof, not promises
What repeat print orders show on stock and speed
Here are the latest figures on retention and print performance from our side of the press, the volume, reorder, and quality signals that round out the picture for businesses planning loyalty campaigns in 2026 and beyond. A 99 percent reorder rate and a 4.8 out of 5 average across 10,000 plus reviews show the quality holds up piece after piece.
Print it
The retention products businesses reach for most
Knowing the retention statistics is step one. Printing the pieces that hit those benchmarks is step two, and it starts with the right product. Here are the retention tools businesses reach for most, from loyalty cards to thank-you postcards.


Why businesses trust us
The press behind the loyalty cards and thank you mailings
Every benchmark on this page sits on a long record of getting print right. A 4.8 out of 5 average across 10,000 plus reviews, 150,000 plus businesses served, and retention print produced since 1999 are the trust signals behind the numbers, so you can plan a loyalty program knowing the pieces will land sharp and on time.
How we built this
Which studies and order records these figures use
Every customer retention statistic on this page comes from published research by recognized sources including Harvard Business Review, Bain and Company, the Data and Marketing Association, PwC, and Bond Brand Loyalty. 4OVER4.COM proprietary data draws from 25 plus years of order history across 150,000 plus business accounts. All figures are current as of the most recent available reporting period, and we update this page as new research becomes available.
Get Started
Ready to turn retention data into repeat customers?
Pick a loyalty card or thank-you postcard, drop in your design or a free template, and we will print it sharp on premium stock and ship it on time.
Legal Disclaimer
Gold Standard guarantees apply to all standard orders placed through 4over4.com. Price match requires verifiable proof of a competitor's published price for an equivalent product with matching specifications and turnaround time. Satisfaction guarantee covers manufacturing defects and print quality issues. Contact support with order number and documentation. On-time delivery rate based on tracked orders 1999 to 2026. Individual results may vary based on shipping carrier performance.
Explore more
Retention guides, loyalty print products and mailing data
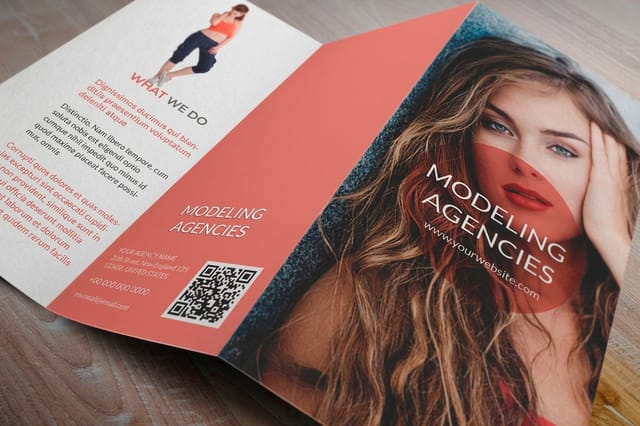
 Product Postcards Print thank-you and loyalty postcards that keep buyers coming back.
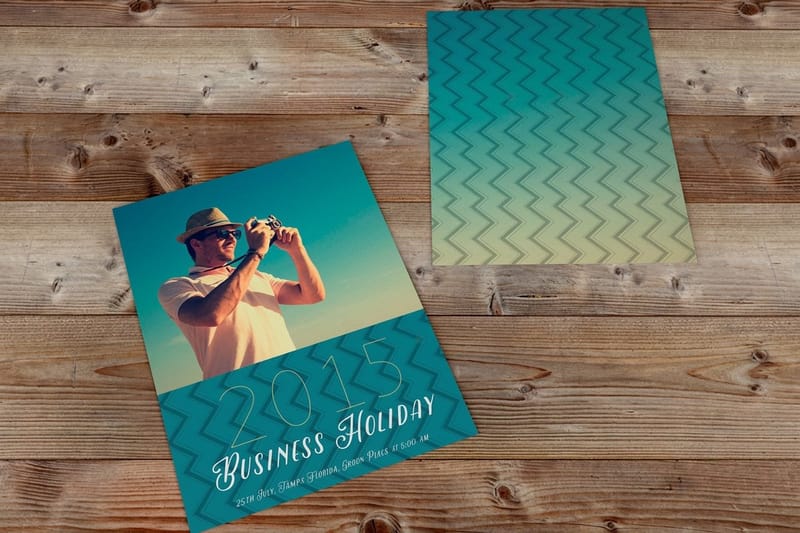
 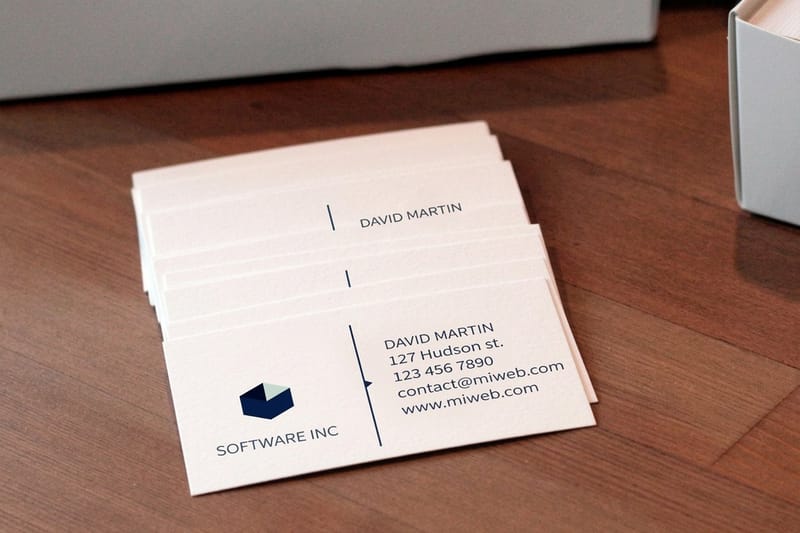 Product Business Cards Loyalty and referral cards customers keep in their wallets.
  Statistics Small Business Statistics Performance benchmarks that put retention in context.
  Statistics Small Business Marketing How marketing spend connects to retention outcomes.
  Statistics Startup Statistics Why early-stage winners build retention in from day one.
  Statistics Failure Rate Data The retention gaps that put businesses at risk.
  Statistics Marketing Budget Benchmarks Allocate spend between acquisition and retention.
  Statistics Small Business Growth Where retention fits into overall growth patterns.
  Guides Printing Guides Step-by-step help designing retention print pieces.
  Free samples Free Print Samples Feel the stocks before you print your loyalty cards.
 Questions and answers
Common questions about customer retention data
Retention rates, acquisition cost, B2B benchmarks, print impact, and revenue, answered.
What is a good customer retention rate?
A good customer retention rate depends on your industry. SaaS and media companies typically see rates above 80 percent, while retail and hospitality average closer to 55 to 65 percent. The customer retention rate by industry varies widely, so compare your numbers against your specific sector benchmarks rather than a universal standard.
How much cheaper is retention compared to acquisition?
Customer retention versus acquisition cost statistics show that acquiring a new customer costs 5 to 25 times more than keeping an existing one. That gap makes retention one of the highest-ROI activities any business can invest in, whether through loyalty programs, direct mail, or improved customer experience.
Do B2B companies have higher retention rates than B2C?
Yes. B2B customer retention statistics typically show rates between 76 and 81 percent, compared to lower averages in most B2C sectors. Higher switching costs, longer sales cycles, and deeper relationships all contribute to stronger B2B retention. However, B2B companies still lose clients to poor communication and inconsistent touchpoints.
Does print marketing actually improve customer retention?
Direct mail response rates average around 4.4 percent, compared to email at 0.12 percent. Physical marketing materials like loyalty cards, thank-you postcards, and branded inserts create tangible brand connections that digital channels struggle to match. You can order free samples to feel the stocks before you commit.
How does customer retention impact revenue?
Retained customers spend 31 percent more per order than first-time buyers and are 50 percent more likely to try new products. According to Bain and Company, a 5 percent increase in retention rates can raise profits by 25 to 95 percent. These customer retention statistics make the financial case for prioritizing existing customers over constant acquisition.
What is the most effective retention strategy for small businesses?
Loyalty programs, personalized follow-up, and consistent brand touchpoints rank among the most effective strategies. For small businesses with limited budgets, printed loyalty cards and direct mail postcards offer high ROI. The key is creating regular, meaningful contact that reminds customers why they chose you. Browse more answers in our printing FAQs.
