
Small Business Infographic with Key Stats & Trends


Startup counts, survival rates, revenue, funding, and digital adoption, set against 25 plus years of printing the posters and cards small businesses put these numbers on.
A good small business infographic turns dry numbers into something people remember. The U.S. has over 33 million small businesses, about 80 percent survive year one, and most run on personal savings. With 150,000 plus businesses printing with 4OVER4.COM, these facts do not just live on a screen, they become posters, flyers, and cards that get read.

The short version
The small business data points you should know
A well-designed small business infographic turns hours of research into a single scannable visual. The headline numbers are consistent: over 33 million small businesses power the U.S. economy, most survive year one but only half reach year five, and the majority run lean on personal savings with no employees beyond the owner. 4OVER4.COM has helped 150,000 plus businesses put facts like these on posters, flyers, and cards, and our Daily Deals are ready when you want to print your finished designs.
Why it matters
Why small business data visualization matters right now
How many owners rely on small business data visualization

Small business data visualization is not a nice-to-have anymore. It is how founders, marketers, and consultants communicate complex ideas fast. A small business infographic condenses hours of research into a single scannable visual, and that is exactly what busy audiences want.
4OVER4.COM works with 150,000 plus businesses, many of them startups and small companies that rely on clear visual communication to grow. We have compiled the most relevant small business facts, growth benchmarks, and marketing trends into one resource. Look closer at the numbers on our small business statistics page, or browse the full small business hub for industry-specific breakdowns.

By the numbers
Four small business figures worth printing
Here are the headline figures founders, marketers, and consultants reach for first when they build a small business infographic, drawn from government sources and cross-checked against the print behavior of 150,000 plus businesses. Lead a pitch deck or investor presentation with numbers like these and your audience gets the scale of small business in a single glance.
Success and failure
The numbers behind small business success and failure
Every small business infographic starts with the right data, and the data tells a story that is both encouraging and sobering. Here is the breakdown section by section so you can use these numbers in your own pitch decks, presentations, and marketing materials.
How many small businesses exist today

The United States is home to over 33 million small businesses, according to the U.S. Small Business Administration, and that number keeps climbing. Small businesses account for 99.9 percent of all U.S. firms and employ nearly half the private workforce.
These are not just numbers on a page. They represent real people building something from scratch. When you lead a startup infographic or investor deck with this kind of scale, your audience immediately gets the context. Small business is the backbone of the economy. For a deeper look at the survival side, see the small business failure rate data we have compiled.
I used a small business infographic in my SBA loan presentation. The visual breakdown of market size and survival rates made the banker actually lean forward in his chair. Numbers alone would not have done that.
Verified customer, verified customer
Small business growth trends worth tracking
Growth is not linear for most small businesses. The first two years are survival mode. Years three through five are where real traction happens, if you make it that far. According to the Bureau of Labor Statistics, about 80 percent of small businesses survive their first year.
By year five, that number drops to roughly 50 percent. By year ten, only about a third are still operating. That is not meant to scare you, it is meant to prepare you. An honest small business infographic helps founders set realistic expectations. Our startup statistics page goes even deeper into early-stage company data.
Revenue and profitability benchmarks

Most small businesses generate less than 1 million dollars in annual revenue. That is not failure, that is normal. The median revenue for businesses with fewer than ten employees hovers around 200,000 to 500,000 dollars, depending on the industry.
Profitability is a different story. Margins vary wildly. Service-based businesses often run leaner with higher margins, while product-based companies deal with inventory, shipping, and manufacturing costs that eat into profit.
When you build a small business data visualization around revenue, context matters. Do not just show the number, show what it means relative to industry, location, and business age. A three-year-old bakery hitting 300,000 dollars in revenue is in a completely different position than a three-year-old software company at the same number.
Employment and hiring patterns
Small businesses with fewer than 500 employees account for roughly 46 percent of private-sector employment in the United States. That is nearly 62 million workers.
Here is what most infographics miss. The majority of small businesses have zero employees beyond the owner. Solo entrepreneurs make up a massive chunk of that 33 million figure, and only about 6 million small businesses actually have paid employees.
This distinction matters when you create visual content. If your audience is solopreneurs, do not show them hiring data that assumes a 20-person team. Tailor the small business facts to the reality of who is reading.
Money and industry
Marketing spend, funding, and where the businesses are
Marketing spend and channels
Small businesses spend an average of 7 to 8 percent of their revenue on marketing, according to the U.S. Small Business Administration. Digital channels dominate, with social media, email, and search advertising taking the largest share.
Print marketing still holds strong in specific industries. Real estate agents, restaurants, fitness studios, and local service providers consistently report that printed materials such as business cards, flyers, postcards, and banners drive foot traffic and build local trust in ways digital cannot replicate. 4OVER4.COM prints 1,000 plus products that small businesses use every day for exactly this purpose. Compare where the dollars go on our small business marketing statistics breakdown.
We printed our small business infographic as a large-format poster for our coworking space. People stop and read it every day. It has become a conversation starter for our consulting business.
Verified customer, verified customer
Funding and capital access
About 77 percent of small businesses rely on personal savings as their primary funding source. Bank loans, credit cards, and lines of credit fill in the gaps. Venture capital is reserved for a tiny fraction, less than 1 percent of small businesses ever receive it.
A startup infographic that breaks down funding sources visually helps founders understand where they actually stand. It also helps lenders and investors see the full picture when they evaluate applications.
The gap between what small businesses need and what they can access is real. According to the Federal Reserve Small Business Credit Survey, about 40 percent of small businesses that applied for financing did not receive the full amount they requested.
Stage and sector
How the metrics shift by stage and industry
A small business infographic becomes more useful when you can compare data across stages and sectors. The challenges a one-year-old company faces look nothing like those of a five-year-old company, and a restaurant owner does not care about software churn rates. Segment your visuals and they connect with the right people.
| Stage | What the data shows |
|---|---|
| Year one | About 80 percent of small businesses are still open, survival mode dominates. |
| Years three to five | Real traction shows, roughly half of all businesses reach year five. |
| Year ten | About a third are still operating, the survivors have found their model. |
| Revenue | Most run under 1 million dollars a year, median sits near 200,000 to 500,000 dollars. |
| Funding | About 77 percent start on personal savings, under 1 percent ever raise venture capital. |
| Industry | Where they sit |
|---|---|
| Professional services | The largest sector by number of firms, from consultants to agencies. |
| Construction | A major employer of small teams and solo contractors. |
| Retail | Storefronts and online shops that lean on local visibility. |
| Food services | Restaurants and cafes where foot traffic and print marketing matter most. |
| Technology | Gets the headlines but represents a small slice of the total pie. |
Understanding where your business falls in this progression helps you benchmark against realistic targets, not aspirational ones. For a closer look at how budgets move across these stages, explore our small business marketing budget data.
Tech and geography
Digital adoption and where small businesses grow
Digital adoption and technology
The pandemic accelerated digital adoption for small businesses by years. E-commerce, cloud tools, and remote work infrastructure went from optional to mandatory almost overnight. Today, over 70 percent of small businesses have a website and social media usage among owners exceeds 80 percent.
Here is what a good small business data visualization captures. Adoption does not equal proficiency. Many small businesses have a website, but fewer than half have one that is optimized for mobile or search. Having a social media account is different from having a social media strategy. The gap between we have it and we use it well is where the real story lives.
Geographic distribution
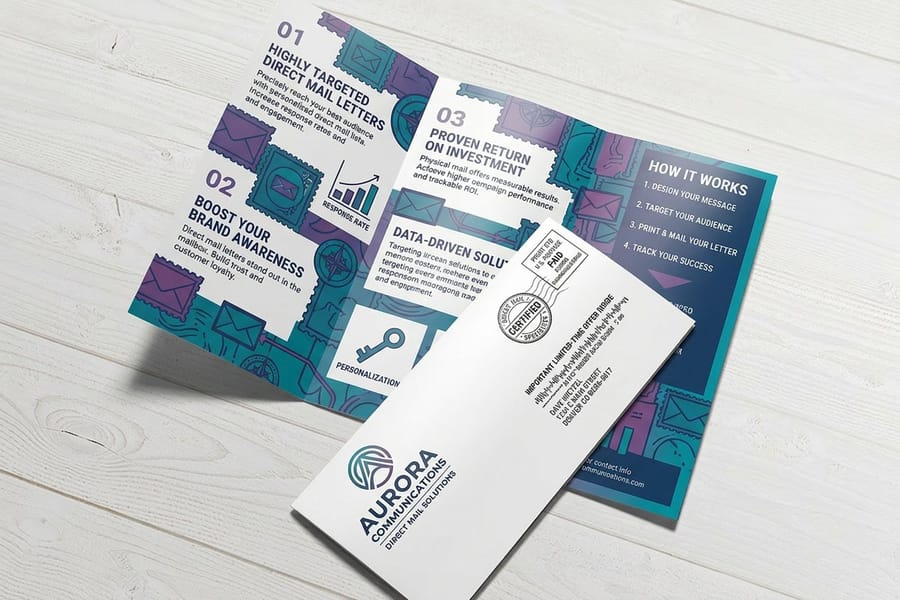
Small business density varies dramatically by state. California, Texas, Florida, and New York lead in total number of firms. But per capita, states like Wyoming, Montana, and Vermont actually have higher rates of small business ownership.
Rural versus urban matters too. Urban small businesses tend to be larger and more diverse in industry type, while rural businesses skew toward agriculture, construction, and local services. If you build a small business infographic for a specific region, geographic data adds a layer of relevance that generic national stats cannot match.
| Channel | Adoption | The nuance |
|---|---|---|
| Website | Over 70 percent have one | Fewer than half are optimized for mobile or search |
| Social media | Over 80 percent of owners use it | An account is not the same as a strategy |
| Digital payments | Adoption climbs every year | Customers now expect tap and mobile checkout |
| E-commerce | Accelerated by the pandemic | Online storefronts went from optional to mandatory |
Proof, not promises
What our poster and card runs show on speed and rating
Here are the quality signals from our side of the press, the delivery, rating, and range that round out the picture for owners printing infographics, posters, and cards in 2026 and beyond. A 99.8 percent on-time delivery rate keeps your deadline safe, and a 4.8 out of 5 average across 10,000 plus reviews shows the print quality holds up piece after piece.
Wally turns the data into your next print run
Statistics are step one. The printed piece is step two.
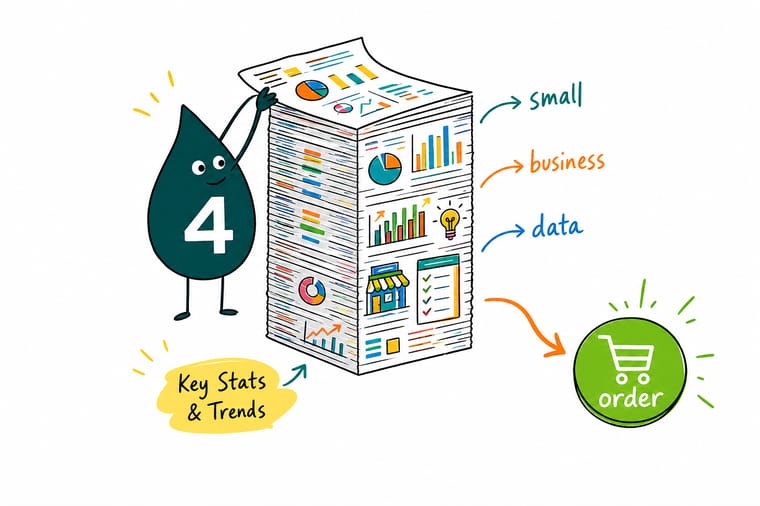
The numbers all point the same way: a small business infographic people can hold beats one lost in a feed. Wally's rule is simple. Pick one clear theme, keep the text light so the visuals carry it, and print it heavy on stock that signals quality. Flyers make the fastest handout and posters own the wall, so they are the quickest way to put this data to work.
Print your infographic →Myths vs facts
Where small business advice and the data part ways
A few assumptions keep owners from reading the data clearly. The pairs below set each common belief against what the small business statistics actually show, so you can plan and present on evidence rather than habit.
Most small businesses have a big team.
The majority have zero employees beyond the owner. Only about 6 million of the 33 million U.S. small businesses have paid staff.
You need venture capital to start.
About 77 percent of owners fund the business from personal savings. Less than 1 percent ever raise venture capital.
Having a website means you are online.
Over 70 percent have a site, but fewer than half are optimized for mobile or search. Adoption is not the same as proficiency.
Tech startups dominate small business.
Professional services, construction, retail, and food services lead by number of firms. Tech gets the attention but a small slice of the pie.
Templates and tools
Templates for your small business infographic
Ready to build your own small business infographic? You do not need to start from a blank canvas. 4OVER4.COM offers design templates that make the process faster and more professional.

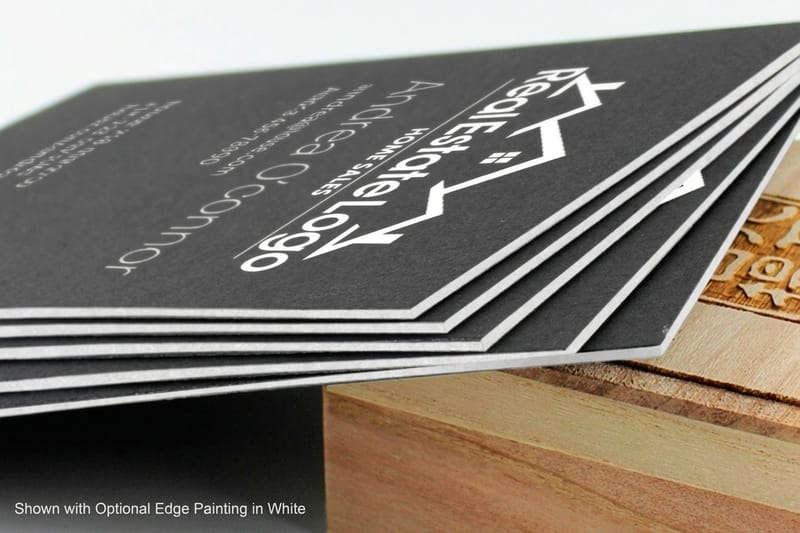
Start from a design
Templates sized for posters, flyers and cards
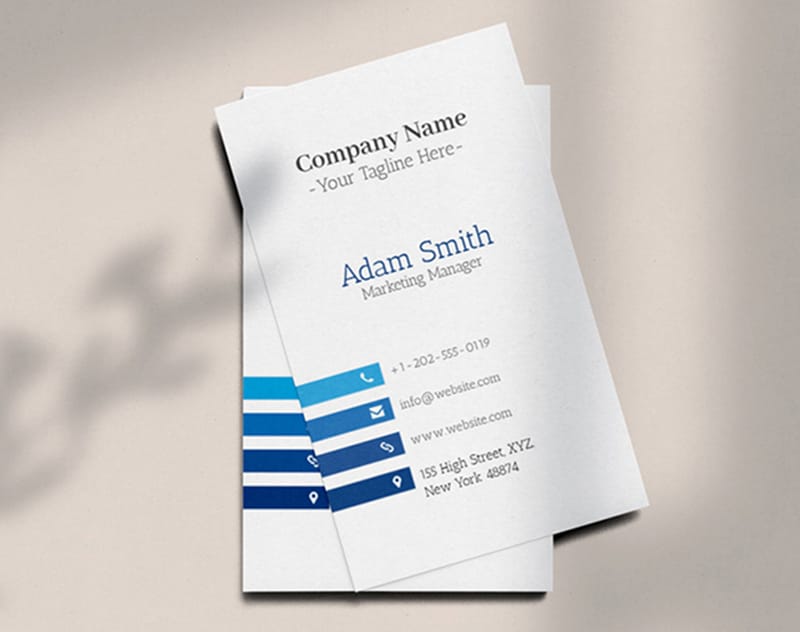
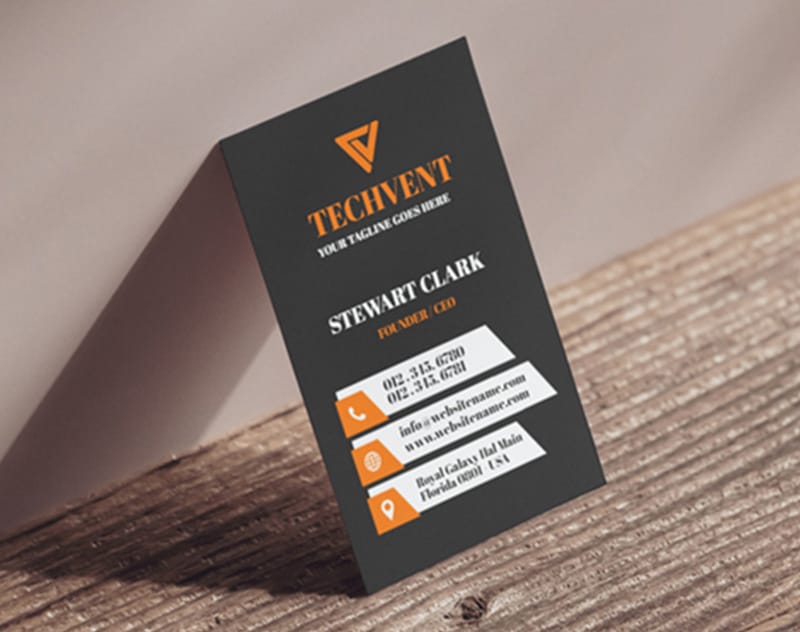
These free templates give you a head start on cards and pieces that carry your small business data, already sized and print-ready. Open any one in the online designer and customize it with your own numbers and branding.
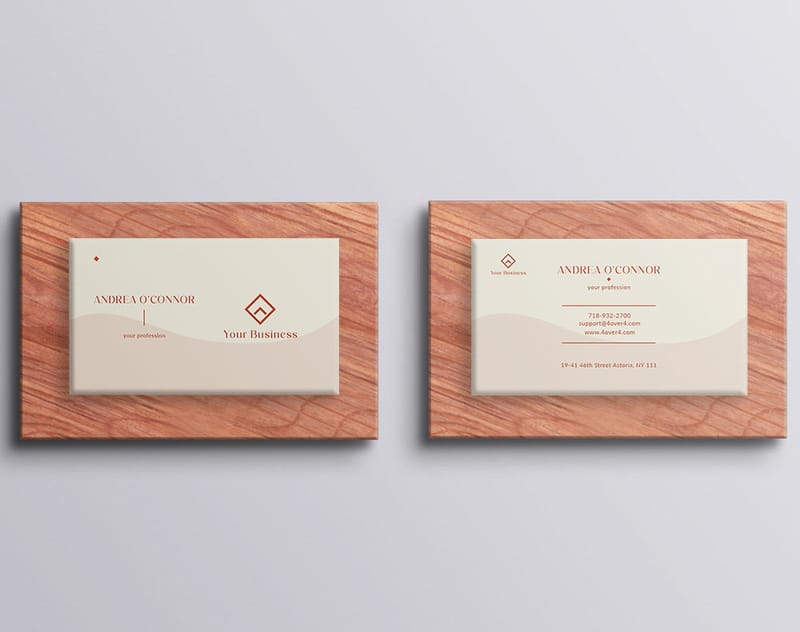



Make it real
Turn your small business infographic into print
You have the data. You have the design. Now make it real. 4OVER4.COM prints your small business infographic on posters, flyers, brochures, and large-format displays, all on 60 plus paper types with finishes that make your visuals pop.
Need it fast? Same Day Printing means you can have your infographic printed and in hand before your next meeting, trade show, or pitch. With 99.8 percent on-time delivery and 82 percent of orders shipping early, you are not gambling with your deadline.
Stock, finishing and price
Flyer pricing and specifications
For owners ready to act on these numbers, here is current pricing for Flyers, the format that works as an 8.5 by 11 handout at events and meetings, alongside the full specifications so you can match the right stock and finish to your infographic.
| Quantity | Price Per Unit | Total |
|---|---|---|
| 50 | 79.1¢ | $39.54 |
| 100 | 57.1¢ | $57.11 |
| 200 | 37.3¢ | $74.69 |
| 300 | 28.6¢ | $85.68 |
| 400 | 24.4¢ | $97.76 |
| 500 | 21.8¢ | $108.75 |
| 600 | 18.7¢ | $112.03 |
| 700 | 16.5¢ | $115.33 |

Print it
The products small businesses reach for most
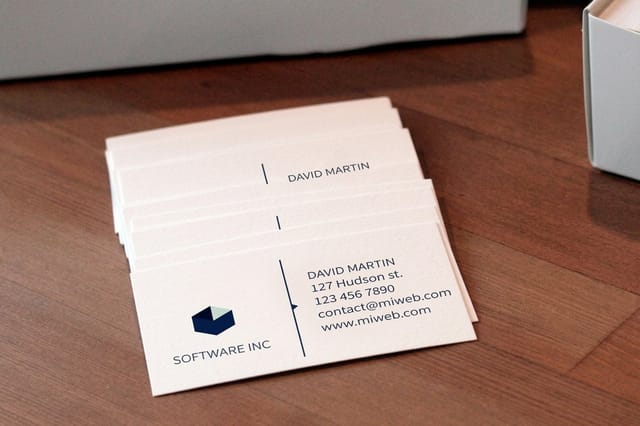
Knowing the small business statistics is step one. Putting them on something people can hold is step two, and it starts with the right piece. Here are the products small businesses order most when they turn data into print.





What our print data reveals
What 4OVER4 order data says about small business print behavior

4OVER4.COM has served 150,000 plus businesses since 1999, and the patterns in our order data tell their own story. Small business owners do not just order business cards. They order posters, flyers, banners, and presentation materials, often with infographic-style designs that communicate data visually.
Our internal data shows that small business customers frequently reorder visual materials within 90 days of their first purchase. That repeat behavior suggests these printed pieces are working. People do not reorder things that collect dust.
With 10,000 plus reviews and a 4.8 out of 5 star average rating, the feedback backs this up. Small business owners consistently mention that professionally printed infographic materials help them get noticed at trade shows, in client meetings, and in their own offices. The small business infographic is not just a digital asset, it is a physical tool that drives real results.
We created a comparison infographic showing our startup growth against industry benchmarks. Printed it on a large poster for our office wall. It keeps the whole team motivated and focused on the numbers that matter.
Verified customer, verified customer
Why owners trust us
The press behind the posters these figures go on
Every benchmark on this page sits on a long record of getting print right. A 4.8 out of 5 average across 10,000 plus reviews, 150,000 plus businesses served, and print since 1999 are the trust signals behind the numbers, so you can order a poster or flyer knowing the piece will land sharp and on time.
How we built this
The sources and order records behind these figures
The small business facts and figures on this page come from publicly available government sources, including the U.S. Small Business Administration, the Bureau of Labor Statistics, and the Federal Reserve Small Business Credit Survey. 4OVER4.COM internal data reflects patterns from 150,000 plus businesses served over 25 plus years of operation. All statistics are verified against their original sources and updated regularly to reflect current conditions.

Get Started
Print 50 posters for $108.75, or 50 flyers for $39.54
Pick the format the numbers belong on, drop in your design or a free template, and choose the stock the run prints on.
Legal Disclaimer
Gold Standard guarantees apply to all standard orders placed through 4over4.com. Price match requires verifiable proof of a competitor's published price for an equivalent product with matching specifications and turnaround time. Satisfaction guarantee covers manufacturing defects and print quality issues. Contact support with order number and documentation. On-time delivery rate based on tracked orders 1999 to 2026. Individual results may vary based on shipping carrier performance.
Explore more
Infographic guides, poster products and small business data
 Statistics Small Business Statistics The full hub of small business data, benchmarks, and trends.
  Statistics Small Business Growth Growth benchmarks and survival curves across the first ten years.
 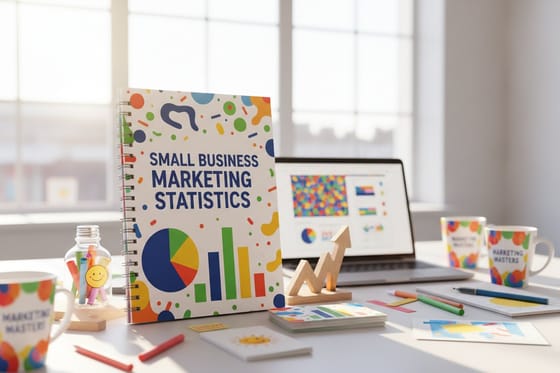 Statistics Small Business Marketing Where owners spend their marketing dollars and what works.
  Statistics Small Business Failure Rate The survival data behind year one, year five, and year ten.
  Statistics Startup Statistics A deeper look at early-stage company data and funding.
  Statistics Marketing Budget Benchmarks How marketing budgets shift across each stage of growth.
 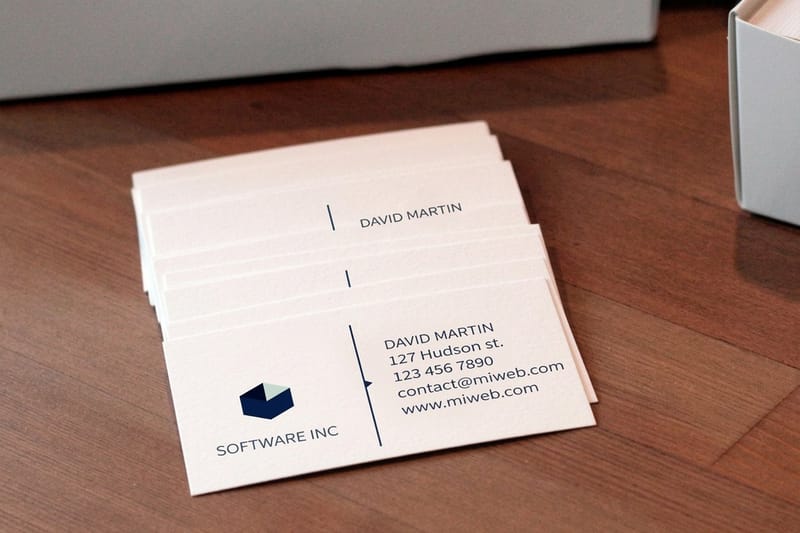 Product Business Cards The core piece almost every small business orders first.
  Product Flyers Print your infographic as an 8.5 by 11 handout that gets kept.
  Benefit Same Day Printing Have your printed infographic in hand before the next meeting. FAQs Printing FAQs Answers on stock, sizes, proofs, and turnaround for print.
 Questions and answers
Common questions about small business infographics
Definitions, how to build one, printing, sizes, and free templates, answered.
What is a small business infographic?
A small business infographic is a visual representation of data, statistics, and trends about small businesses. It combines charts, icons, and concise text to communicate complex information quickly. Owners, marketers, and consultants use them in presentations, social posts, and printed materials to make small business facts easier to understand and share.
How do I create a small business data visualization?
Start with reliable data from sources like the SBA or the Bureau of Labor Statistics. Choose a clear theme such as growth rates, funding sources, or industry breakdowns. Use a design tool or template to arrange your data into charts, keep text minimal, and let the visuals carry the message. Then print it or share it digitally.
Can I print my infographic as a poster or handout?
Yes. 4OVER4.COM prints infographic designs on posters, flyers, brochures, and large-format displays. Choose from 60 plus paper types and multiple finishes, upload your design, and select your size and quantity. Most orders ship within one to two business days. Order free samples first if you want to feel the stock before you commit.
What data should a startup infographic include?
A startup infographic should cover survival rates, funding sources, revenue benchmarks, and industry-specific trends. Showing how many businesses make it past year one, year five, and year ten gives founders realistic expectations. Add geographic or demographic breakdowns if your audience is location-specific. Visit our Help Center if you need guidance on file setup for print.
What size works best for a printed small business infographic?
For office display or trade show use, 24 by 36 inches is a popular poster size. For handouts at events or meetings, 8.5 by 11 inch flyers or tri-fold brochures work well. The right size depends on how much data you are presenting and where people will view it. Larger formats let you include more detail without cramping the design.
Are there free templates for small business infographics?
4OVER4.COM offers design templates you can customize with your own data and branding. These templates are sized for print, so your finished infographic looks sharp on screen and on paper. Templates save time and help you keep a professional layout even without a graphic design background.
