
Trade Show ROI Statistics & Benchmarks for 2026


Real benchmarks, a working calculator, and the print factor most exhibitors miss, set against the order data behind 25 plus years of printing for trade shows at 4OVER4.
Trade show ROI is the measurable return on every dollar you spend to exhibit. The metrics that matter go beyond leads collected: cost per qualified contact, close rate on event leads, and revenue tracked over six to twelve months. Undercounted costs and missing follow-up sink most returns, while premium collateral lifts recall and conversion. With 150,000 plus businesses printing show materials at 4OVER4.COM, the pattern is clear.
The short version
What trade show ROI actually looks like in 2026
Trade show ROI is the measurable return your business gets from every dollar spent on exhibitions, booths, printed materials, and staff time. Most companies track it wrong, or do not track it at all, which is a problem when the average booth costs thousands before you hand out a single card. The numbers below break down what real returns look like, how to calculate them, and the print factor that quietly moves the needle. 4OVER4.COM has helped 150,000 plus businesses prepare show materials, and the pattern is consistent year after year.
Why it matters
Why measuring trade show ROI matters more than ever
Trade show ROI is the measurable return your business gets from every dollar spent on exhibitions, booths, printed materials, and staff time. It is not a nice-to-have metric. It is the difference between knowing your marketing budget works and hoping it does. Most companies track it wrong, or skip tracking altogether, which is a problem when the average booth costs thousands before you hand out a single business card or brochure.
According to the Center for Exhibition Industry Research, face-to-face events remain one of the top B2B marketing channels, but only when companies actually measure outcomes. The metrics that matter go beyond leads collected. Think cost per qualified contact, post-show conversion rate, and brand impressions per dollar. 4OVER4.COM has helped 150,000 plus businesses prepare print materials for trade shows, and the pattern is clear: companies that invest in quality collateral close more deals after the event. Use the Online Designer to build show-ready materials fast, and check our price match guarantee before your next show.
For cross-industry benchmarking, our wedding industry statistics show how event-driven businesses track similar returns, and the full industry marketing statistics library helps you set realistic expectations before you commit budget.
Count everything
The true cost of exhibiting
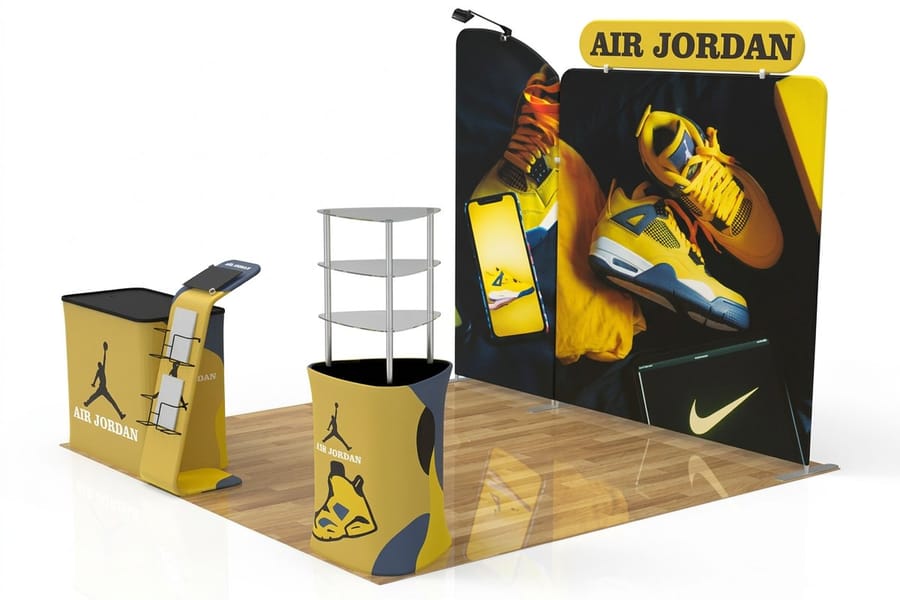
Your booth space fee is just the beginning. Most exhibitors undercount their total investment by 30 to 40 percent, according to Exhibitor Magazine's annual cost survey. Calculating trade show ROI starts with counting every line, and here is what usually gets missed:
- Booth construction and design for custom displays, signage, lighting, and furniture rental
- Printed materials like business cards, brochures, postcards, flyers, and banners that carry your brand on the show floor
- Staff costs covering travel, hotels, meals, and the opportunity cost of pulling your best salespeople off their pipeline
- Pre-show marketing across email, social ads, and mailers that drive booth traffic
- Post-show follow-up including CRM time, personalized outreach, and nurture campaigns
Add it all up and the average ten by ten booth at a mid-size show runs between fifteen thousand and thirty-five thousand dollars all in. Larger setups reach six figures fast. That is why measuring trade show ROI is not optional, it is financial survival.
The hard part
Revenue attribution done right
Here is where most companies fall down. A lead scanned at your booth in March might not close until September. By then the deal has touched email, a demo call, a proposal, and maybe a site visit. Who gets credit? The best approach is multi-touch attribution with a trade show first-touch tag, so the show earns weighted credit when the booth was the first meaningful interaction. HubSpot, Salesforce, and Pipedrive all support this with custom fields.
Track these specific data points for accurate trade show ROI metrics:
- Leads collected from badge scans, business card drops, and QR code scans on printed materials
- Qualified leads that match your ideal customer profile and show buying intent
- Meetings booked on-site and scheduled directly from event contact
- Pipeline generated as the total dollar value of opportunities created
- Closed revenue tracked over six to twelve months after the event
The print factor
The print materials factor in trade show ROI
Here is something most trade show ROI calculators miss entirely: the quality of your printed collateral directly affects lead quality and conversion. A flimsy card gets tossed. A thick, textured card with a soft-touch finish stays in a wallet. 4OVER4.COM prints on 60 plus paper types across 1,000 plus products, and for trade shows the materials that move the needle are clear:
- Ultra Thick 32pt business cards three times thicker than standard, signalling premium positioning before you say a word
- Custom postcards pre-printed with show offers and QR codes for instant follow-up
- Retractable banners portable, professional, and reusable across events
- Brochures and sell sheets leave-behinds that keep selling after the conversation ends
- Custom stickers low-cost, high-engagement giveaways that turn attendees into walking billboards
We switched to 32pt Velvet Business Cards from 4OVER4.COM for our annual industry expo, and the difference was immediate. Prospects commented on the card quality, which opened conversations we would not have had otherwise. Our post-show meeting rate jumped noticeably.
Verified customer, VP of Sales
By industry
Industry-specific trade show ROI benchmarks
Trade show ROI benchmarks vary widely by industry. A SaaS company with a fifty thousand dollar annual contract value needs far fewer conversions to hit positive ROI than a consumer brand selling twenty dollar products. Context sets your target.
Different sectors approach event marketing differently. Our restaurant failure rate data shows how food service businesses allocate marketing budgets, and trade shows take a real share. Our real estate marketing statistics reveal that agents who invest in heavy printed materials at open houses and expos see measurably higher engagement.
For professional services, our law firm marketing statistics show that face-to-face networking events drive some of the highest-value client acquisitions in the legal industry.

By the numbers
Four numbers the ROI calculator runs on
Here are the headline figures marketers reach for first when they plan an exhibition, drawn from industry research and our own production data. Costs get undercounted, most leads never get a follow-up, and the exhibitors who win treat print quality as a lever, not an afterthought. Set those benchmarks against 25 plus years of printing show materials at 4OVER4.COM and the picture stays consistent.
The calculator
Building a trade show ROI calculator that works
Forget the overcomplicated spreadsheets floating around online. A practical trade show ROI calculator needs five inputs and one output. The formula is simple: qualified leads times close rate times average deal value, minus total event cost, divided by total cost, times 100.
| Input | What it means |
|---|---|
| Total event cost | Booth, travel, materials, staff time, and follow-up combined |
| Qualified leads | Contacts that match your ideal profile and showed buying intent |
| Close rate on event leads | The share of qualified leads that become customers |
| Average deal value | Revenue per closed deal, or customer lifetime value |
| Attribution window | How long you track conversions, six months minimum |
Side by side
How trade show ROI stacks up against other channels
Trade show ROI does not exist in a vacuum. Smart marketers compare it against every other channel competing for budget. The question is not just whether the show made money, it is whether it made more money per dollar than the other options. Industries like healthcare face the same comparison. Our healthcare marketing statistics explore how medical companies weigh event marketing against digital spend.
| Channel | Trust | Response and recall | Cost | Trackable |
|---|---|---|---|---|
| Trade shows | High, face-to-face builds trust fast | High-quality leads, longer sales cycle | Highest upfront cost | Yes, with first-touch tags |
| Direct mail | Strong, people hold physical pieces | Higher response, strong recall | Higher per piece | Yes, with codes and QR |
| Lower, easy to ignore | Around 20 percent open, low recall | Very low per send | Yes | |
| Paid social | Lower, scrolled past | Low intent, short attention | Low cost per impression | Yes |
Trade show leads come with face-to-face interaction, which builds trust faster than any click funnel. The trade-off is higher upfront cost and a longer sales cycle. Events typically win on deal size and lead quality while losing on cost per lead, so your net ROI depends on your price point and close rate. 4OVER4.COM's 99.8 percent on-time delivery rate protects that ROI by making sure your materials arrive before day one, not two days after the show starts.
Myths vs facts
What exhibitors miscount when they total a show
A few myths keep exhibitors from measuring returns that would justify the spend. The pairs below set each common assumption against what the trade show ROI data actually shows, so you can plan your next event on evidence rather than habit.
Trade show ROI cannot really be measured.
Track cost per qualified lead, close rate on event leads, and revenue over a six to twelve month window. Tag each lead first touch in your CRM and the numbers get precise.
The booth budget is the whole cost.
Booth space is the start. Travel, staff time, printed collateral, pre-show marketing, and follow-up push the real total 30 to 40 percent higher than most exhibitors expect.
Leads collected is the metric that matters.
Badge scans mean little without follow-up. Qualified leads, meetings booked, pipeline value, and closed revenue are the metrics that show whether the show paid off.
Cheap collateral is fine, nobody keeps it.
A flimsy card gets tossed. A 32pt card with a soft-touch finish stays in a wallet. Premium materials lift recall and post-show conversion.
Where ROI lives or dies
Post-show follow-up is the deciding factor
According to the Trade Show News Network, 80 percent of trade show leads never receive follow-up. That single stat explains why so many companies report negative trade show ROI. The event is only the introduction. The money comes from what happens next: follow up within 48 hours, send a physical custom postcard with a show-specific offer within a week, segment leads into hot, warm, and cold, and log every interaction in your CRM.
Wally turns the ROI math into your next booth
Benchmarks are step one. The materials are step two.
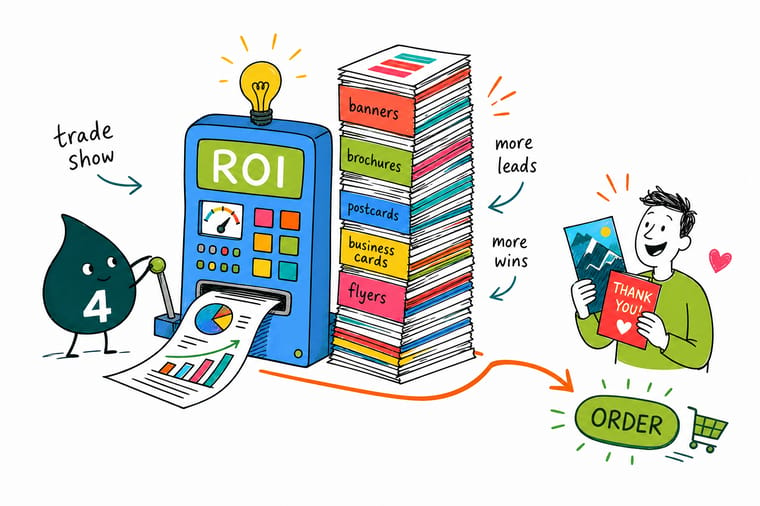
The numbers all point the same way: count every cost, capture qualified leads, and follow up fast, but the quiet lever is print quality. Wally's rule is simple. Show up with collateral people want to keep, tag every lead's first touch, and let the close rate do the rest. Exhibitors undercount cost by 30 to 40 percent and 80 percent of leads go dark, so a business card worth keeping is the one input in the ROI math you settle before the show opens.
Order business cards →Proof, not promises
What show collateral costs and when it ships
Here are the quality and reliability signals from our side of the press, the figures that round out the picture for exhibitors planning for 2026 and beyond. A 99.8 percent on-time delivery rate keeps your show schedule intact, an 82 percent ship-early rate builds in a buffer, and a 4.8 out of 5 average across 10,000 plus reviews shows the print quality holds up piece after piece.
Stock, finishing and price
The stock that gets a card kept, priced at 100
For exhibitors ready to act on these numbers, here is current pricing for Business Cards, the collateral that signals premium positioning before you say a word, alongside the full specifications so you can match the right stock and finish to your show goals.
Start from a blank
Blank templates to start your artwork
Every template carries the trim, bleed and safe margin for its piece, so a show set can be drawn once and uploaded without a resize.


Print it
The trade show materials exhibitors reach for most
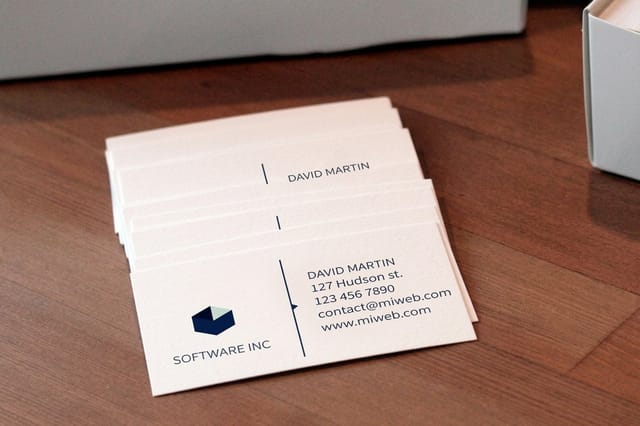
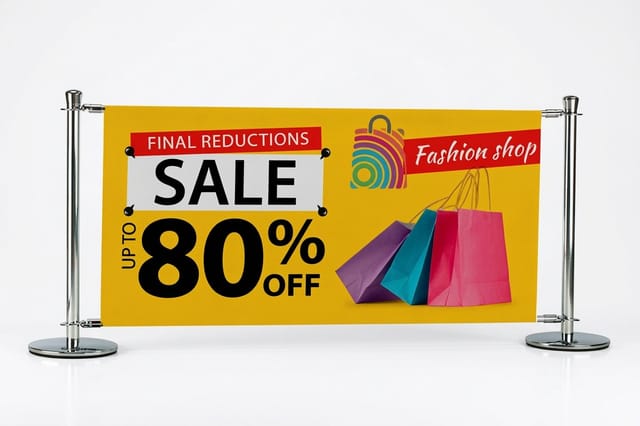
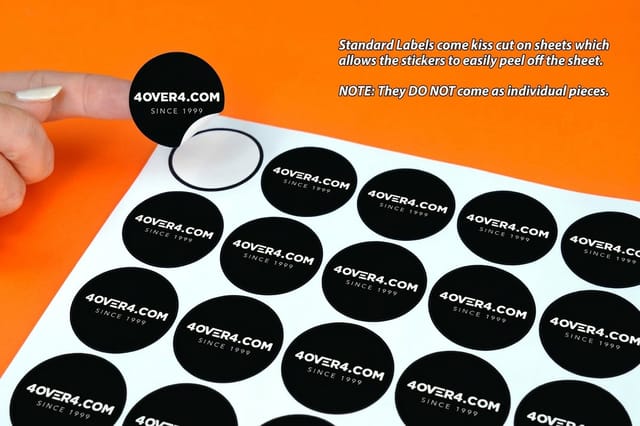
Every line in the calculator above eventually becomes a printed piece. Indoor banners print in 2 business days, Standard Business Cards 100 for $17.57 in 3, flyers 50 for $39.54, and stickers 25 for $23.88. These are the pieces exhibitors budget for.



What our print data reveals
What 4OVER4 order data says about trade show prep
Third-party trade show statistics are valuable, but 4OVER4.COM's own order data, drawn from 150,000 plus businesses since 1999, adds another layer. Businesses that order event-specific materials, custom banners, show-branded business cards, and targeted brochures, reorder at higher rates than those using generic collateral. Our internal data shows 99 percent of customers reorder, and trade show season, January through March and August through October, drives the highest volume of rush orders for display materials.
These patterns line up with broader industry data. Browse our full industry marketing statistics library for sector-specific benchmarks that help you set realistic expectations before committing budget to your next event.
I have been exhibiting for twelve years. The single biggest improvement to our trade show ROI came from upgrading our printed materials, not our booth design and not our pitch. Better cards, better brochures, better leave-behinds. People remember what they can touch.
Verified customer, Director of Events
Why exhibitors trust us
The press behind the collateral in these ROI figures
Every benchmark on this page sits on a long record of getting show materials printed right. A 4.8 out of 5 average across 10,000 plus reviews, 150,000 plus businesses served, and print produced since 1999 are the trust signals behind the numbers, so you can plan a booth knowing the pieces will land sharp and on time.
How we built this
How we compiled this trade show ROI data
The trade show ROI statistics and benchmarks on this page come from published industry research, including reports from the Center for Exhibition Industry Research, Exhibitor Magazine, and the Trade Show News Network. Internal data points reference 4OVER4.COM's order history across 150,000 plus business customers over 25 plus years of operation. Every metric is presented with source context, and we update this page as new industry data becomes available.

Get Started
Order the show set: 100 cards at $17.57, banners in 2 days
Pick your show materials, drop in a design or a free template, and we will print them sharp on premium stock and ship them on time.
Legal Disclaimer
Gold Standard guarantees apply to all standard orders placed through 4over4.com. Price match requires verifiable proof of a competitor's published price for an equivalent product with matching specifications and turnaround time. Satisfaction guarantee covers manufacturing defects and print quality issues. Contact support with order number and documentation. On-time delivery rate based on tracked orders 1999 to 2026. Individual results may vary based on shipping carrier performance.
Explore more
Trade show guides, booth products and ROI benchmarks
 Statistics Wedding Industry Data How another event-driven industry tracks returns and spend.
  Statistics Restaurant Failure Rate How food service businesses allocate their marketing budgets.
  Statistics Real Estate Marketing Why printed materials lift engagement at open houses and expos.
  Statistics Law Firm Marketing How face-to-face events drive high-value client acquisition.
  Statistics Healthcare Marketing How medical brands weigh events against digital spend. Hub Industry Statistics Sector-by-sector marketing benchmarks in one library.
 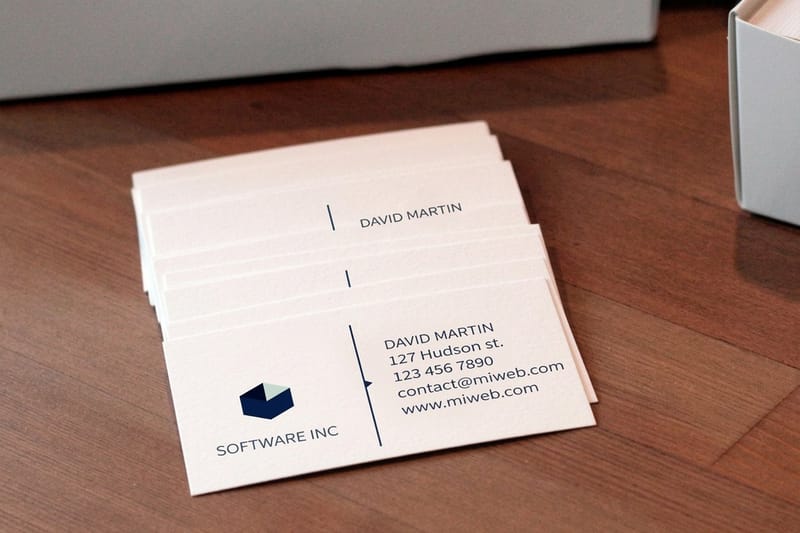 Product Business Cards Print the 32pt cards that get kept, not tossed, on the show floor.
  Product Brochures Leave-behinds that keep selling after the conversation ends.
  Benefit Online Designer Build show-ready materials fast, right in your browser. Showcase Print Showcase Real customer print across stocks, finishes, and sizes.
  Benefit Bulk Discounts Per-piece price drops fast as your order quantity climbs. FAQs Printing FAQs Answers on stock, sizes, proofs, and turnaround.
 Questions and answers
Common questions about trade show ROI
Calculation, benchmarks, metrics, print quality, and timing, answered.
How do you calculate trade show ROI?
Use this formula: revenue from show leads minus total event cost, divided by total event cost, times 100. Include every cost, from booth space and travel to printed materials, staff time, and post-show follow-up. Track revenue attribution for at least six months after the event, since many deals take time to close.
What is a good trade show ROI percentage?
Any return above zero means the event paid for itself. Most successful exhibitors target 100 to 500 percent, meaning they earn two to six dollars for every dollar spent. Your benchmark depends on industry, deal size, and sales cycle length. B2B companies with high-value contracts can hit strong ROI with fewer conversions.
What trade show ROI metrics should I track beyond leads?
Track cost per qualified lead, meetings booked on-site and after the show, pipeline value generated, close rate on event leads versus other sources, and the lifetime value of show-acquired clients. Add brand metrics like booth traffic, social mentions, and press coverage for the full picture.
How does print material quality affect trade show ROI?
High-quality printed materials, thick business cards, professional brochures, and sharp banners, increase booth engagement and post-show recall. Prospects keep premium materials longer, which extends your brand visibility after the event. 4OVER4.COM offers 60 plus paper types so you can match material quality to your positioning. Order free samples to feel the stocks first.
Is there a simple trade show ROI calculator I can use?
Yes. You need five numbers: total event cost, qualified leads collected, your close rate on event leads, average deal value, and your tracking window. Multiply leads by close rate by deal value for projected revenue, subtract total cost, divide by total cost, and multiply by 100 for your percentage.
When should I start measuring trade show ROI?
Start before the show. Log every pre-event cost as it happens, capture lead data in real time during the event, then set a six to twelve month attribution window afterward. Review results at 30, 90, and 180 days to see how your pipeline develops over time.
