
Restaurant Failure Rate Statistics Every Owner Should Know


First-year and five-year failure rates, the causes behind them, and the marketing moves that separate survivors from statistics, backed by 25 plus years of printing for restaurants at 4OVER4.
Roughly 60 percent of restaurants close within their first year, and nearly 80 percent shut down before year five. The failures follow patterns, from undercapitalization and poor location to weak branding. Owners who plan their capital, pick their spot on data, and market on multiple channels beat the odds. 4OVER4.COM has helped 150,000 plus businesses build that brand presence with menus, table tents, and postcards.

The short version
The restaurant failure rate numbers every owner should know
The restaurant failure rate sits among the highest of any industry. Roughly 60 percent of restaurants close within their first year, and nearly 80 percent shut down before their fifth anniversary. Understanding why restaurants fail, from poor location to weak marketing, gives owners a real shot at beating the odds. 4OVER4.COM has helped 150,000 plus businesses build a stronger brand presence, and every order is backed by our Price Match guarantee. For comparison, browse our wedding industry statistics or the full library of industry marketing statistics.
Why it demands attention
Why the restaurant failure rate deserves a closer look

The restaurant failure rate is one of the most talked-about statistics in small business. It is also one of the most misunderstood. Some sources inflate the numbers and others downplay them. The truth is that restaurant closures happen at a rate that should make every aspiring owner pause, plan, and prepare before signing a lease.
Restaurant industry statistics from the Bureau of Labor Statistics, the National Restaurant Association, and academic studies give us a clearer picture. The data shows that failure is not random. It follows patterns, with undercapitalization, poor marketing, weak branding, and location mistakes topping the list.
The National Restaurant Association reports that the U.S. restaurant industry generates over 1 trillion dollars in annual sales and employs more than 15.7 million people. That is a massive market. But size does not equal stability. The new restaurant failure rate stays stubbornly high because barriers to entry are low while operating costs are brutal. 4OVER4.COM compiled this data to help restaurant owners make better decisions.

By the numbers
Restaurant failure at a glance
Here are the headline figures owners reach for first when they weigh whether to open, drawn from published research and industry reporting. The restaurant failure rate first year is where the biggest losses happen, with roughly 60 percent of new restaurants failing within 12 months and about 80 percent within five years. Set those benchmarks against a trillion-dollar market and the picture is consistent: the opportunity is huge, but the margin for error is thin.
Causes and marketing
Restaurant failure rate broken down by year, type, and cause
Restaurant failure rate statistics cover a lot of ground, from first-year losses and concept type to the marketing decisions that move survival odds. Here is the full breakdown so you can plan, budget, and market with the numbers in front of you.
First-year restaurant failure rate: what kills new concepts

The restaurant failure rate first year is driven by a handful of predictable mistakes. Undercapitalization is the biggest killer. Most new owners underestimate how much cash they burn before reaching profitability, so industry experts suggest holding 6 to 12 months of operating expenses in reserve before opening day.
Poor location is the second most common cause. A restaurant in the wrong spot struggles to generate foot traffic even with great food, and without foot traffic you depend entirely on marketing to drive awareness.
That is where restaurant marketing statistics become relevant. Data from Toast and the National Restaurant Association shows that restaurants investing in both digital and print marketing see higher customer retention than those relying on digital alone. Table tents, printed menus, loyalty cards, and direct mail postcards still drive measurable results.
We opened with zero marketing budget and almost closed in month four. Once we started putting out printed menus and table tents in nearby businesses, foot traffic jumped 30 percent in six weeks.
Marcus L., restaurant owner, Austin, TX
Restaurant failure rate by type: fast casual, fine dining, and full service

Not all restaurant types fail at the same rate. Restaurant industry statistics show meaningful differences based on concept and service model. Fast casual restaurants tend to have lower failure rates than full-service establishments because lower labor costs, simpler operations, and smaller footprints make them more resilient.
Fine dining carries the highest risk. The overhead is enormous, from premium ingredients to experienced staff to upscale interiors. Full-service restaurants fall in the middle, requiring heavy staffing and inventory management but generating strong revenue per table when managed well.
The key differentiator across every type is marketing consistency and brand recognition. Restaurant marketing statistics from the Small Business Administration show that businesses investing at least 3 to 6 percent of gross revenue in marketing have measurably higher survival rates. For restaurants, printed menus, flyers, and business cards are survival tools, not extras. You can see comparable patterns in our real estate marketing statistics breakdown.
How marketing impacts the restaurant failure rate

Restaurant marketing statistics consistently show a connection between marketing investment and survival. A study by the National Restaurant Association found that restaurants with a defined marketing strategy were 2.5 times more likely to survive past year three than those without one.
Print marketing plays a specific role. While digital ads drive awareness, printed materials build tangible brand presence. A well-designed menu on thick card stock tells customers you take your business seriously, and a flimsy laser-printed menu says the opposite.
4OVER4.COM has printed materials for 150,000 plus businesses, including thousands of restaurants. From custom menus on premium paper to promotional postcards and loyalty cards, print gives restaurants a physical touchpoint that digital cannot replicate. The same patterns show up across industries like law firm marketing statistics and healthcare marketing statistics.
I ordered custom loyalty cards and table tents from 4OVER4.COM right before our grand opening. The quality made us look like we had been open for years. Customers kept the loyalty cards in their wallets, and that repeat business kept us alive through our first winter.
Diana R., cafe owner, Portland, OR
The usual suspects
The top 10 reasons restaurants fail
Based on aggregated restaurant failure rate statistics from multiple industry sources, these are the most common causes of closure. Most are preventable with planning and consistent marketing.
| Cause | What it looks like |
|---|---|
| Undercapitalization | Running out of cash before break-even, typically within 6 to 9 months. |
| Poor location | Low visibility, limited parking, or mismatched demographics. |
| Weak branding and marketing | No consistent identity across menus, signage, and promotional materials. |
| Inexperienced management | First-time owners without a hospitality or business operations background. |
| Inconsistent food quality | Failing to hold standards as volume increases. |
| High employee turnover | The industry averages 75 percent annual turnover per the Bureau of Labor Statistics. |
| Ignoring customer feedback | Not adapting menus, service, or atmosphere based on reviews. |
| Overexpansion | Opening a second location before the first is profitable. |
| No online presence | Missing from Google, Yelp, and social platforms. |
| Failure to differentiate | Blending into a crowded market without a clear value proposition. |
What survivors do
What successful restaurants do differently

Restaurant failure rate statistics tell us what goes wrong, and the flip side is just as informative. Restaurants that survive past year five share common traits. They cook great food, but they also run tight operations and invest in how they present themselves to the world.
Every printed menu, every business card handed to a vendor, and every promotional flyer in a hotel lobby adds up. Community engagement through local partnerships, events, and printed materials keeps a restaurant top of mind long after the meal ends.
- Strong brand identity Consistent visual branding across menus, signage, uniforms, and marketing materials.
- Adequate capitalization Starting with enough cash reserves to weather the slow months.
- Community engagement Local partnerships, events, and printed promotional materials in the neighborhood.
- Adaptability A willingness to adjust menus, hours, and concepts based on customer data.
- Multi-channel marketing Digital presence paired with physical touchpoints like postcards, flyers, and loyalty programs.
Timeline and concept
Failure rate by year and by restaurant type
The restaurant failure rate looks different depending on the time horizon and the concept. The curve is steep in the early years, then flattens for the operators who make it through. Fast casual, full service, and fine dining each carry their own risk profile.
| Milestone | What the data shows |
|---|---|
| Year 1 | Roughly 60 percent of new restaurants close, the steepest drop of any milestone. |
| Year 2 | Losses keep mounting as opening capital runs thin and the novelty fades. |
| Year 3 | Owners with a defined marketing strategy are 2.5 times more likely to reach this point. |
| Year 5 | Close to 80 percent have closed, leaving operators who invested in brand and systems. |
| Type | Risk profile |
|---|---|
| Fast casual | Lower failure rate, thanks to leaner labor, simpler menus, and smaller footprints. |
| Full service | Middle of the pack, with strong revenue per table when staffing and inventory stay tight. |
| Fine dining | Highest risk, as premium ingredients, skilled staff, and upscale interiors inflate overhead. |
The common thread across every type is marketing consistency. Businesses that invest 3 to 6 percent of gross revenue in marketing, including printed menus, flyers, and business cards, show measurably higher survival rates.
Proof, not promises
Restaurant printing by the numbers at 4OVER4
Here are the signals that round out the picture for owners planning their next print run. A 99.8 percent on-time delivery rate keeps grand-opening materials on schedule, a 4.8 out of 5 average rating across 10,000 plus reviews shows the print quality holds up, and 60 plus paper types let you choose a menu stock that feels as good as your food tastes.
Wally turns the data into your next print run
Statistics are only step one. The pieces are step two.
The numbers all point the same way. Restaurants that plan their capital, pick their location on data, and market on multiple channels beat the odds. Wally's rule is simple. Print your menu heavy on stock that signals quality, keep loyalty cards in customers' wallets, and mail promotional postcards to the neighborhood. Postcards are the fastest, lowest-cost way to put this data to work.
Order postcards →Stock, finishing and price
Promotional postcard pricing and specifications
For owners ready to act on these numbers, here is current pricing for Postcards, a low-cost way to drive neighborhood foot traffic, alongside the full specifications so you can match the right stock and finish to your campaign goals.
| Quantity | Price Per Unit | Total |
|---|---|---|
| 50 | 33.0¢ | $16.48 |
| 100 | 24.2¢ | $24.16 |
| 200 | 15.9¢ | $31.86 |
| 300 | 12.8¢ | $38.45 |
| 400 | 11.3¢ | $45.04 |
| 500 | 10.3¢ | $51.62 |
| 600 | 9.89¢ | $59.31 |
| 700 | 9.57¢ | $67.00 |

Start from a blank
Blank templates for restaurant print pieces
Need a head start on design? These blank templates make it easy to get your artwork print-ready, with bleed and safe margins already built in.
Side by side
How the restaurant failure rate compares to other industries
Restaurant failure rate statistics become most useful when you compare them against other small businesses. About 20 percent of all small businesses fail in their first year across every industry, and restaurants fail at roughly three times that rate. The gap narrows over five years but restaurants still close at a much higher rate. Even creative ventures like those in our kids printing collection show that a strong visual identity matters at every level.
| Industry | Year 1 | Year 5 | Key pressure |
|---|---|---|---|
| Restaurants | ~60% | ~80% | Thin margins, high labor, perishable inventory |
| Retail | ~25% | ~50% | Inventory risk and foot-traffic swings |
| Construction | ~25% | ~50% | Project cycles and cash-flow gaps |
| Professional services | ~19% | ~50% | Client acquisition and specialization |
| All small business | ~20% | ~50% | Undercapitalization across the board |
The restaurant industry is not just hard. It is structurally harder than most other small business categories. Thin margins, high fixed costs, perishable inventory, and intense local competition create a perfect storm. That is why every advantage matters, from location selection to the quality of your printed menus and marketing collateral.
Retail businesses close at about 25 percent in year one, construction sits around 25 percent, and professional services hover near 19 percent. Restaurants, at roughly 60 percent, are in a league of their own when it comes to first-year closures.
Myths vs facts
Clearing up restaurant failure misconceptions
A few myths keep owners from making the moves that would improve their odds. The pairs below set each common assumption against what the restaurant failure rate statistics actually show, so you can plan on evidence rather than habit.
Great food alone keeps a restaurant open.
Food quality matters, but undercapitalization, poor location, and weak marketing close far more restaurants than the menu ever does.
Marketing is a luxury new restaurants can skip.
Restaurants with a defined marketing strategy are 2.5 times more likely to survive past year three, and 3 to 6 percent of revenue in marketing correlates with higher survival.
Print is dead, so digital ads are enough.
Restaurants that combine digital and print see higher customer retention, and a premium printed menu builds trust that a banner ad cannot.
The 90 percent first-year failure rate is a hard fact.
The credible figure is closer to 60 percent in year one, sourced from the Cornell Hotel and Restaurant Administration Quarterly, not the inflated numbers some blogs repeat.
Print it
The print products restaurants reach for most
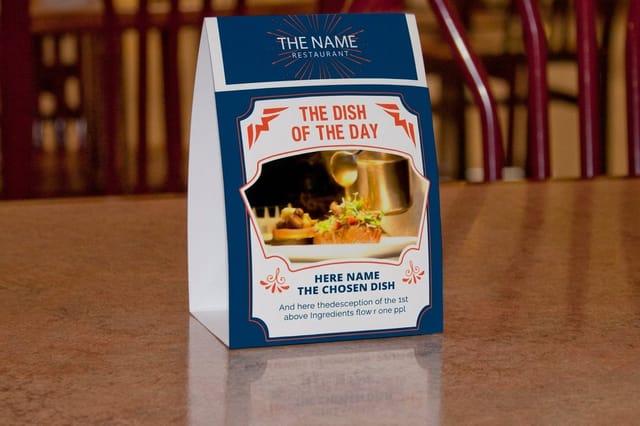
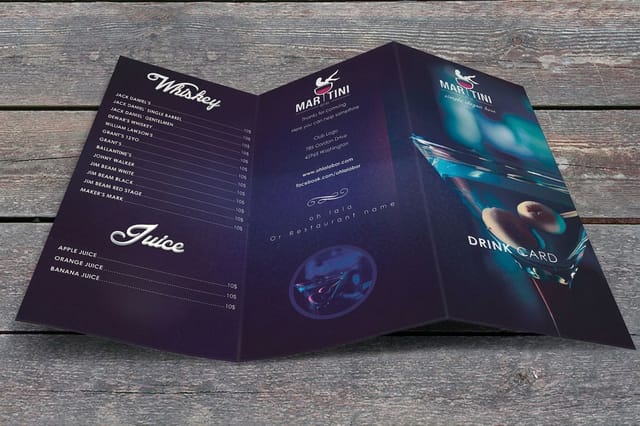
Knowing the restaurant failure rate is step one. Executing a plan that beats it is step two, and it starts with the right pieces. Here are the products restaurant owners reach for most when they put this data to work.




What our print data reveals
What 4OVER4 order data says about restaurants

Restaurant failure rate data from third-party sources is valuable. But 4OVER4.COM's own data, drawn from 150,000 plus businesses ordering print since 1999, adds another layer of insight. Restaurant owners make up a big portion of that base, and the patterns are telling.
Restaurant clients who reorder printed materials such as menus, table tents, business cards, and promotional postcards within 90 days of their first order show higher long-term retention. That reorder behavior signals an active, marketing-conscious business, and marketing-conscious restaurants are the ones that tend to survive.
We also see that owners who invest in premium paper stocks for their menus, meaning 16pt and above, reorder more frequently than those who choose standard options. The restaurant failure rate drops when owners sweat the small stuff, including how their brand looks and feels in a customer's hands.
The quality of our menus and table tents from 4OVER4.COM made the whole room feel more premium. Regulars started ordering more, and our repeat business carried us through a slow first winter.
Verified customer, restaurant owner
Why owners trust us
Backed by 25 plus years of printing
Every benchmark on this page sits on a long record of getting restaurant print right. A 4.8 out of 5 average across 10,000 plus reviews, 150,000 plus businesses served, and print produced since 1999 are the trust signals behind the numbers, so you can order menus and postcards knowing the pieces will land sharp and on time.
How we built this
How we compiled these restaurant failure rate statistics
The restaurant failure rate data on this page comes from publicly available sources including the Bureau of Labor Statistics, the National Restaurant Association, the Cornell Hotel and Restaurant Administration Quarterly, and the Small Business Administration. 4OVER4.COM cross-referenced these sources with our own internal client data spanning 25 plus years of serving restaurant owners. All figures represent the most recently available data at the time of publication.

Get Started
Ready to beat the restaurant failure rate?
Pick a piece, drop in your design or a free template, and we will print it sharp on premium stock and ship it on time.
Legal Disclaimer
Gold Standard guarantees apply to all standard orders placed through 4over4.com. Price match requires verifiable proof of a competitor's published price for an equivalent product with matching specifications and turnaround time. Satisfaction guarantee covers manufacturing defects and print quality issues. Contact support with order number and documentation. On-time delivery rate based on tracked orders 1999 to 2026. Individual results may vary based on shipping carrier performance.
Explore more
Keep going across the industry statistics silo
Statistics Industry Marketing Statistics Browse the full library of industry data and benchmarks.  Statistics Wedding Industry Statistics How the wedding market spends on print and marketing.
  Statistics Real Estate Marketing Statistics Response and ROI benchmarks for real estate marketing.
  Statistics Law Firm Marketing Statistics What legal marketing spend and returns look like.
  Statistics Healthcare Marketing Statistics Engagement benchmarks across healthcare marketing.
  Product Postcards Mail promotional postcards that drive local foot traffic.
 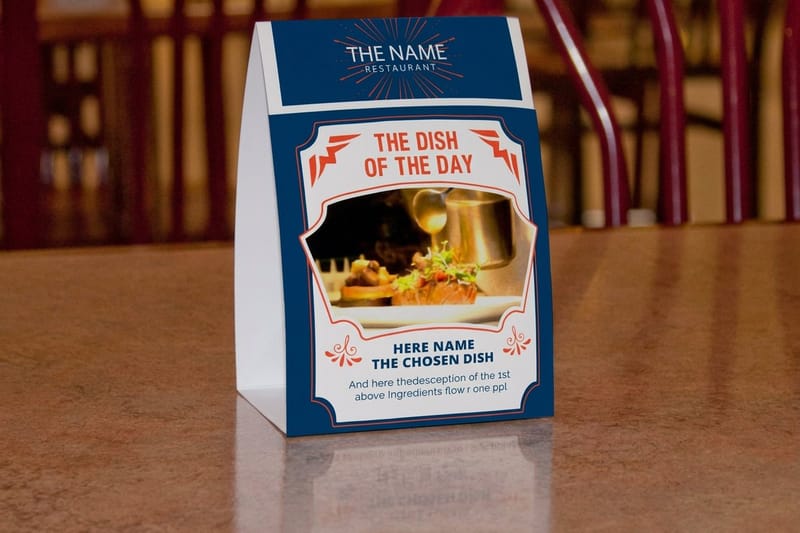 Product Table Tents Upsell specials and drinks right at the table.
 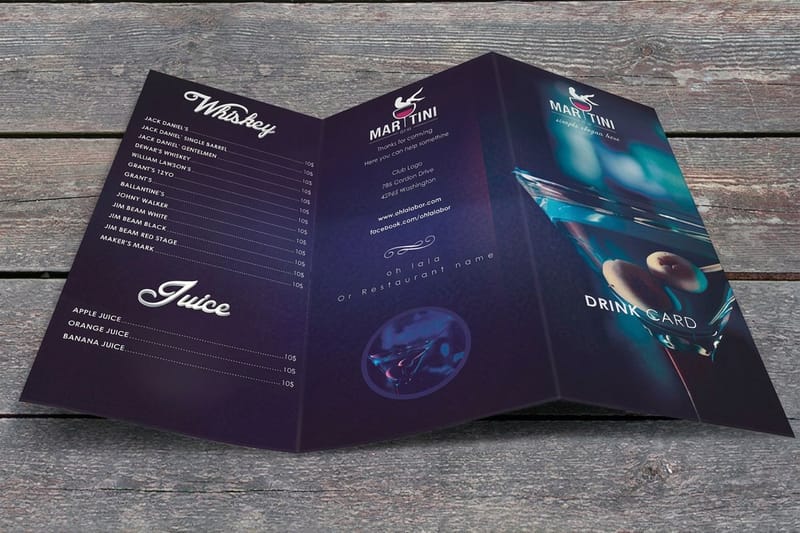 Product Menus Premium menu printing that signals quality from the first glance.
  Templates Blank Templates Print-ready templates with bleed and safe margins built in. FAQs Printing FAQs Answers on stock, sizes, proofs, and turnaround.
 Questions and answers
Common questions about restaurant failure rates
First-year odds, why concepts fail, print marketing, and how to reduce your risk, answered.
What is the restaurant failure rate in the first year?
The restaurant failure rate first year is approximately 60 percent, according to data from the Cornell Hotel and Restaurant Administration Quarterly. That is roughly three times higher than the average small business failure rate of 20 percent in year one. Undercapitalization and poor location are the two leading causes of first-year closures.
Why do so many new restaurants fail?
The new restaurant failure rate stays high because of thin profit margins near 3 to 5 percent, high labor costs, perishable inventory, and intense local competition. Many first-time owners underestimate startup costs by 30 to 50 percent. Weak branding and inconsistent marketing add to the risk, and restaurants without a defined marketing strategy are far less likely to survive past year three.
Does print marketing actually help restaurants survive?
Yes. Restaurant marketing statistics show that businesses combining digital and print marketing see higher customer retention. Printed menus, loyalty cards, table tents, and promotional postcards create physical brand touchpoints that digital ads cannot replicate. Visit our Showcase to see examples of restaurant print materials that drive results.
What percentage of restaurants close within five years?
Restaurant failure rate statistics indicate that roughly 80 percent of restaurants close before their fifth anniversary. The steepest losses happen in years one and two. Restaurants that survive past year three have far better odds of long-term success, especially those with strong brand identity and consistent marketing programs.
How does the restaurant failure rate compare to other industries?
Restaurants fail at a much higher rate than most industries. While the average small business first-year failure rate is about 20 percent, restaurants hit roughly 60 percent. Retail and construction average around 25 percent. By year five, about 50 percent of all small businesses close, compared to 80 percent of restaurants. The gap reflects the unique operational challenges of food service.
What can restaurant owners do to reduce their failure risk?
Start with adequate capital reserves of 6 to 12 months of operating expenses, choose your location based on data rather than gut feeling, and invest in professional branding from day one. That includes high-quality printed menus, business cards, and promotional materials. Build a multi-channel marketing strategy and adapt based on customer feedback. For more tips and resources, visit the Help Center at 4OVER4.COM.
