
Healthcare Marketing Statistics for 2026


Patient acquisition cost, direct mail response, email open rates, and channel ROI for medical and dental practices, set against 25 plus years of healthcare print at 4OVER4.
Healthcare marketing works when data guides the spend. Direct mail response runs 3 to 5 percent, email opens sit near 21 to 23 percent, and a new patient costs 150 to 350 dollars to acquire before referrals and print based retention pull that number down. With 150,000 plus businesses printing at 4OVER4.COM and 10 billion plus cards produced, the data confirms what practices feel: patients trust materials they can hold.
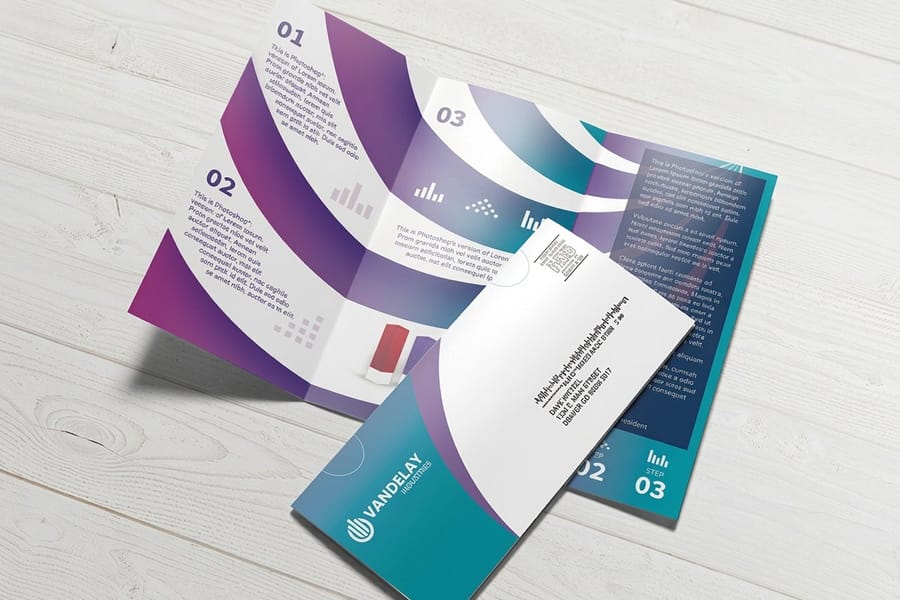
The headline
What patient acquisition actually costs by channel
Healthcare marketing statistics point one direction. Digital claims the largest share of most budgets, but print and direct mail keep earning their 15 to 25 percent because response rates in medical and dental practices beat email in the same sector. Patient acquisition costs run high, so the practices that lower them combine referral programs with tangible touchpoints like appointment cards and brochures. With 150,000 plus businesses trusting 4OVER4.COM for their print, the patterns in the data hold year after year.
Why it matters
Why medical marketing data matters right now
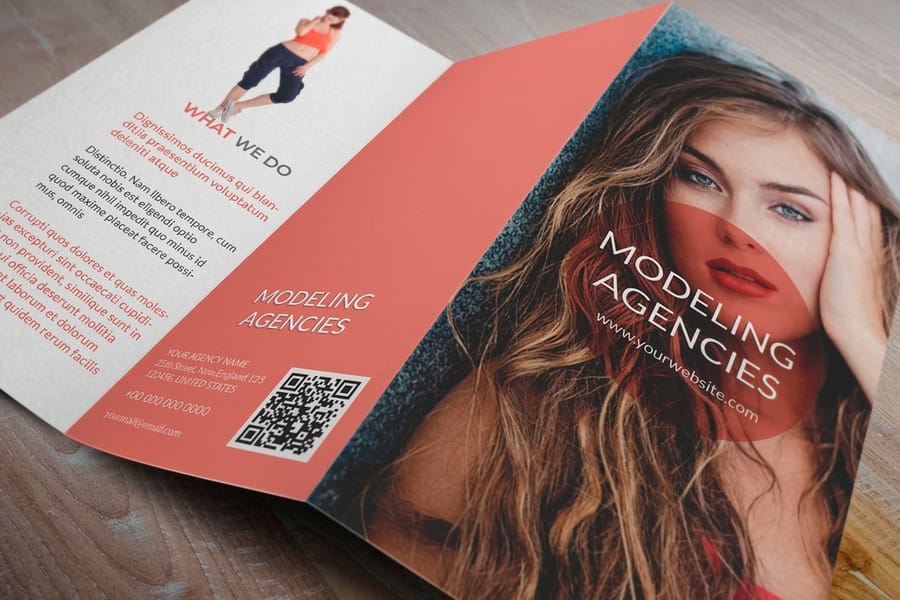
Medical marketing data is the difference between a full waiting room and one that echoes. Healthcare advertising has topped 30 billion dollars in recent years and keeps climbing, and the practices that track their marketing outperform the ones that guess.
4OVER4.COM works with medical, dental, and wellness brands that lean on print to build patient trust. With 10,000 plus reviews and a 4.8 out of 5 rating, we have watched data driven print campaigns beat generic ones, and a QR code on a brochure or mailer makes that engagement easy to track. For a contrast with another industry, see our wedding industry data.
The modern patient journey starts online and often converts through something tangible, whether an appointment reminder card or a branded folder. Explore custom projects to bring your healthcare materials to life, or compare notes with our real estate marketing statistics.

By the numbers
Four figures a practice marketing budget turns on
Here are the headline figures healthcare marketers reach for first when they plan a campaign, drawn from industry benchmarks and our own production data. Email opens sit near 21 to 23 percent, direct mail response runs 3 to 5 percent, and a new patient costs 150 to 350 dollars to acquire. Set those against 25 plus years of healthcare print at 4OVER4.COM and the picture stays consistent: the pieces patients can hold get acted on.
Channels and specialties
Healthcare advertising across channels and specialties
Healthcare advertising statistics tell a clear story: patients research before they book, and they convert through tangible touchpoints. This breakdown covers digital, print, patient acquisition, channel ROI, content, dental, and budget allocation, drawing on the benchmarks practices watch most.
Digital healthcare marketing benchmarks

Digital channels take the largest slice of healthcare marketing budgets. Hospitals and health systems keep shifting spend toward search, social, and paid display, and the average cost per click for competitive healthcare keywords like dentist near me or orthopedic surgeon runs well above the cross industry norm.
Email still earns its keep for patient retention. Healthcare email open rates sit around 21 to 23 percent, above the cross industry average, because patients actually want appointment reminders, wellness tips, and seasonal updates from their providers.
Social media plays a different role here than in retail. It is less about direct conversions and more about brand awareness and community trust, and practices that post educational content consistently see higher inquiry rates than those that only push promotions.
We started tracking our digital ad spend against patient bookings and realized our Google Ads were bringing in 40 percent of new patients. The data changed how we budget everything.
Dr. Rachel K., Family Medicine
Print marketing performance in healthcare
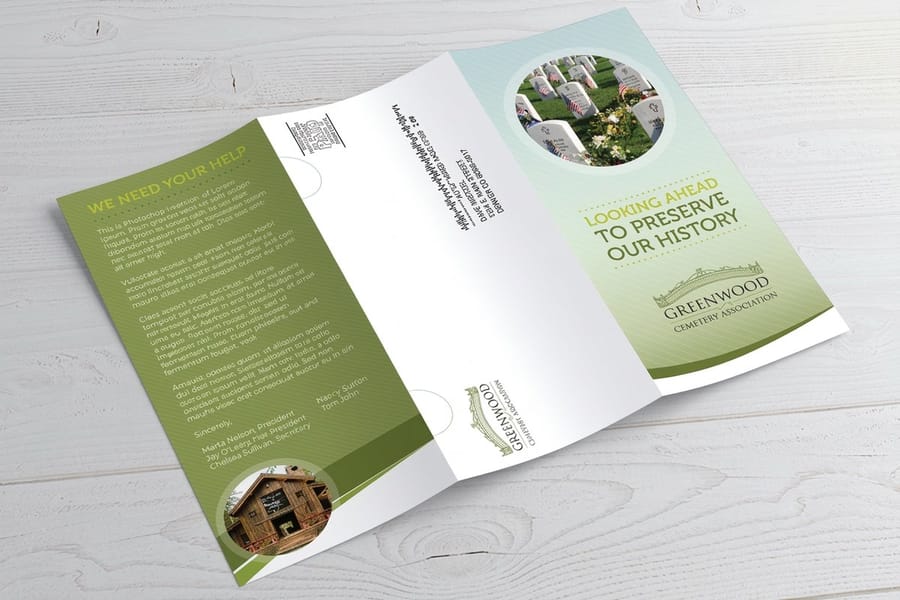
Print is quietly one of the highest performing channels in healthcare. Direct mail response rates for medical and dental practices land between 3 and 5 percent, which beats email response in the same sector, because patients trust what they can hold.
4OVER4.COM prints appointment cards, referral pads, branded folders, and patient welcome kits for practices across the country. With 1,000 plus products on the menu, there is a print piece for every touchpoint in the patient journey.
Brochures and handouts still carry patient education. When someone leaves with a printed guide to their condition or treatment plan, they retain more than from a verbal explanation alone, and that is how people process information.
Quality is the lever. A flimsy brochure on thin stock sends the wrong message in a medical setting, since patients read print quality as care quality. For a parallel in another trust driven field, see our law firm marketing statistics.
Patient acquisition cost by specialty
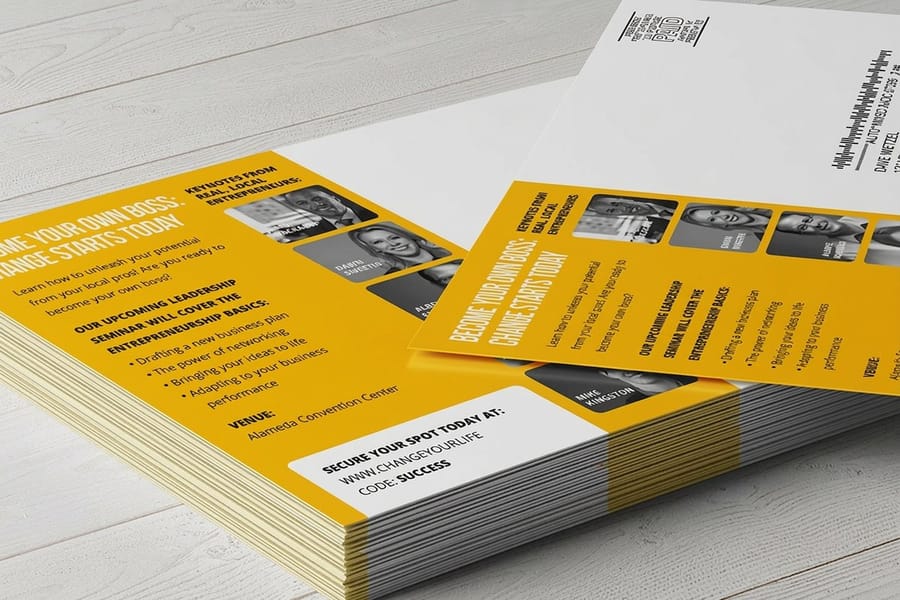
Patient acquisition costs swing widely across specialties. General practitioners spend less per new patient than specialists, while cosmetic surgery, dermatology, and dental implant practices sit at the high end because competition for those patients is fierce.
Across all channels, the average practice spends between 150 and 350 dollars to bring in one new patient. That number drops sharply once referral programs and print based retention enter the mix, since a fifty cent reminder card that keeps a patient coming back costs almost nothing next to fresh acquisition.
Dental practices face their own math. Most need 20 to 50 new patients a month to keep growing, and more in dense urban markets. The winners pair digital presence with physical touchpoints like recall cards, welcome packets, and community mailers.
Medical marketing return on investment by channel
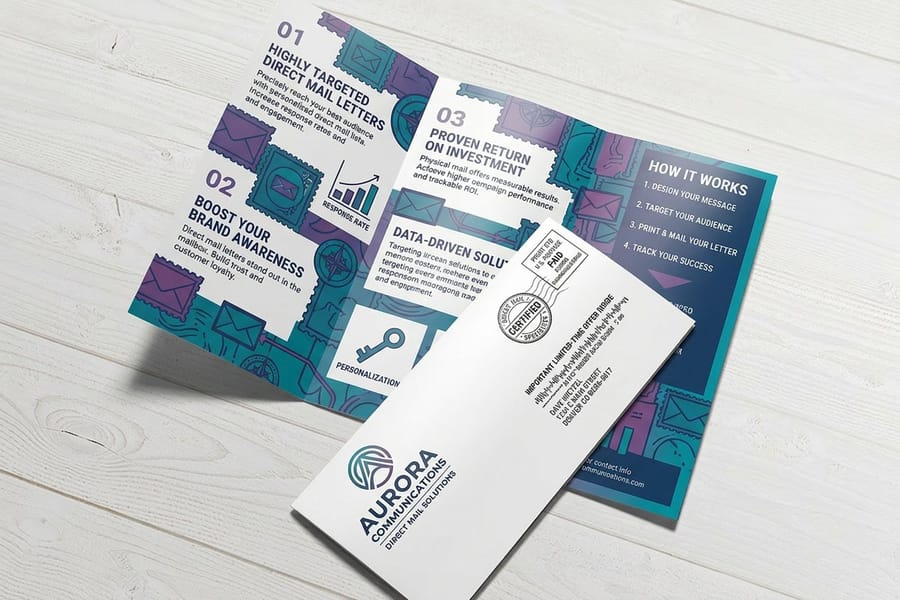
Not every channel returns the same. Referral programs top the list, because a referred patient costs almost nothing to acquire and tends to carry a higher lifetime value. Print supports referrals directly through referral cards, branded notepads for referring physicians, and thank you cards that keep the pipeline moving.
Search improvement pays off over the long run but asks for patience, with most healthcare campaigns taking six to twelve months to show real movement. Paid search delivers faster at a higher ongoing cost, so most practices land on a blend of both.
Targeted direct mail earns strong returns. A postcard drop to households within a five mile radius of a new practice can spark a measurable jump in new patient calls within weeks. Our restaurant failure rate data shows the same pattern, where early local marketing helps a business last.
Healthcare content marketing trends

Content marketing is now standard for healthcare organizations. Hospitals and large systems publish blogs, videos, and patient stories to build authority, and smaller practices benefit too as long as the format fits.
Video performs especially well. Patient testimonials, doctor introductions, and procedure explainers pull high engagement, and practices that use video on their sites see longer sessions and better conversion.
Print rounds out the mix inside the office. A quarterly newsletter mailed to existing patients reinforces the relationship between visits, and a QR code that links to online scheduling bridges the printed page and the booking screen.
Dental marketing statistics and practice growth
Dental marketing deserves its own spotlight, because the industry runs differently from general healthcare. Dental practices are almost always private businesses competing block by block, so marketing is survival rather than an option.
The average dental practice puts 5 to 8 percent of revenue into marketing, and practices in growth mode push past 10 percent. The split between digital and traditional varies, yet the strong performers use both, and online reviews sway new patient decisions more in dentistry than in almost any other specialty.
In office print does double duty. It markets elective services like whitening, implants, and cosmetic work to current patients, and it educates. A well placed brochure about clear aligners in the waiting room converts more consultations than most dentists expect.
Our recall postcards from 4OVER4.COM reduced our no-show rate by about 15 percent. Patients actually keep them on the fridge, and you cannot pin an email to a fridge.
Marcus T., Dental Office Manager
Healthcare marketing budget allocation patterns
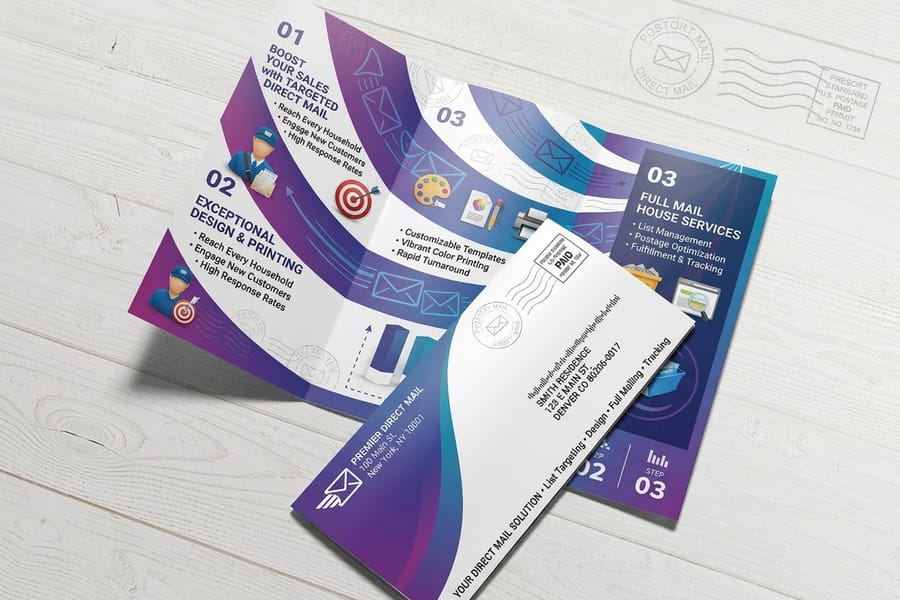
How practices split their budgets reveals what actually works. Digital usually claims the largest share at roughly 40 to 60 percent of total spend, while print and direct mail still hold 15 to 25 percent, especially where local patient acquisition is the goal.
Event marketing, community sponsorships, and physician referral programs fill out the rest. The practices that grow fastest are not the ones spending the most, they are the ones tracking every channel and reallocating toward what performs.
Pieces and specialties
How each print piece and specialty performs
Not every print piece plays the same role, and benchmarks shift by specialty, but the thread is constant: put a physical piece in a patient's hands and it earns attention. Match the right piece to the right touchpoint and the numbers follow.
| Piece | Where it wins |
|---|---|
| Appointment cards | Kept in wallets and on fridges, and they cut no-shows. |
| Patient brochures | Explain procedures and lift information retention. |
| Referral cards | Feed the highest ROI channel in healthcare. |
| Welcome folders | Set a premium first impression for new patients. |
| Recall postcards | Bring patients back on a predictable schedule. |
| Specialty | Benchmark |
|---|---|
| General practice | Lower acquisition cost, steady quarterly reorders. |
| Dental | 5 to 8 percent of revenue spent on marketing. |
| Cosmetic and dermatology | Highest acquisition cost, review driven. |
| Hospital networks | Broad brand campaigns across every channel. |
| Wellness and clinics | Local mail with QR tracking to booking. |
Your piece should match your goal. Cutting no-shows calls for appointment cards. Reactivating lapsed patients calls for recall postcards. Educating before a procedure calls for a premium brochure. Each specialty has its own benchmarks, but the common thread is local relevance and quality.
Make it relevant
Personalization and tracking in healthcare mail
Personalized healthcare mail outperforms generic mail by a wide margin. Variable data printing tailors the name, offer, and message on each piece, and a QR code turns a printed brochure or postcard into a measurable channel by linking straight to online scheduling. The more relevant and trackable the piece, the higher the response.
Proof, not promises
What practice print orders show on stock and speed
Here are the quality and volume signals that round out the picture for practices planning campaigns in 2026 and beyond. A 99.8 percent on-time delivery rate keeps your patient mailings on schedule, and a 4.8 out of 5 average across 10,000 plus reviews shows the print quality holds up piece after piece.
Wally turns the data into your next patient touchpoint
Statistics are only step one. The piece is step two.
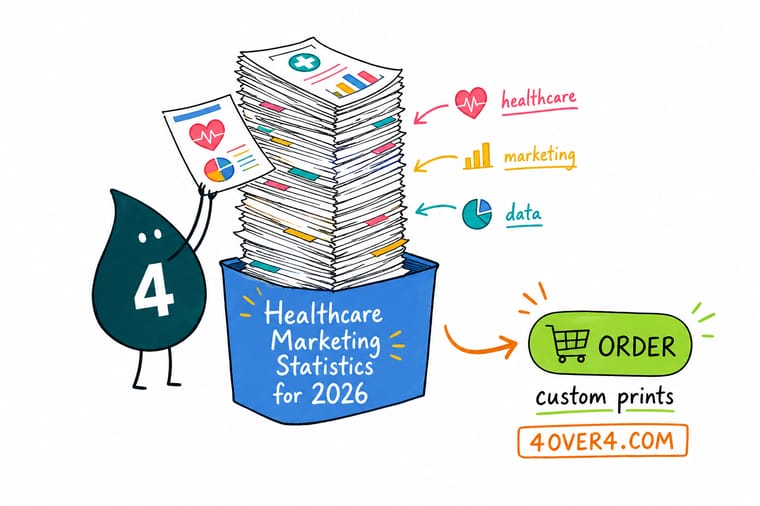
The numbers all point the same way: a premium piece in a patient's hands beats a message lost in their inbox. Wally's rule is simple. Match the piece to the touchpoint, print it heavy on stock that signals quality, and add a QR code so every mailer becomes trackable. When a new patient costs 150 to 350 dollars to acquire, a brochure that answers the questions asked in the waiting room pays for itself long before the 3 to 5 percent mail response is counted.
Order brochures →Stock, finishing and price
Brochure pricing and specifications
For practices ready to act on these numbers, here is current pricing for Brochures, the piece that carries patient education, alongside the full specifications so you can match the right stock and finish to your goals.
| Quantity | Price Per Unit | Total |
|---|---|---|
| 50 | $1.14 | $57.11 |
| 100 | 82.4¢ | $82.38 |
| 200 | 53.3¢ | $106.55 |
| 300 | 41.0¢ | $123.02 |
| 400 | 34.9¢ | $139.49 |
| 500 | 31.2¢ | $155.97 |
| 600 | 26.7¢ | $160.36 |
| 700 | 23.5¢ | $164.75 |

Side by side
Mail, email and search set against each other
Healthcare marketing statistics become most useful when you compare channels against each other. Every dollar competes for the best return, so the table below puts direct mail, email, paid search, and referrals in context for a medical or dental practice.
| Channel | Trust | Response and value | Cost | Trackable |
|---|---|---|---|---|
| Direct mail | High, patients keep it | 3 to 5 percent response | Higher per piece | Yes, with QR and codes |
| Moderate, patients opt in | 21 to 23 percent open | Very low per send | Yes | |
| Paid search | Low, intent driven | Fast but pricey clicks | High ongoing cost | Yes |
| Referrals | Highest, word of mouth | Best lifetime value | Near zero to acquire | Harder to attribute |
Referrals win on lifetime value and cost, direct mail wins on local trust and response, and digital wins on speed and reach. The strongest practices do not pick one, they combine them, and a printed piece that drives a patient to an online booking page captures the strengths of both.
4OVER4.COM has printed 10 billion plus cards and mailers, and the feedback is consistent. Quality print on premium stock earns better results than thin, flimsy alternatives, because in a medical setting the medium is part of the message.
Across industries
How healthcare compares to other industries in marketing spend
Healthcare marketing statistics gain meaning next to other industries. Budget focus, acquisition cost, and print reliance differ sharply between healthcare, legal, real estate, and hospitality, which helps healthcare marketers benchmark their own performance against broader trends.
| Industry | Marketing focus | Acquisition cost | Print reliance |
|---|---|---|---|
| Healthcare | Trust building, local patient reach | $150 to $350 per patient | High, 15 to 25 percent of budget |
| Legal | Credibility and referral led | High per client | Moderate to high |
| Real estate | Hyperlocal neighborhood farming | Moderate per lead | High, postcards dominate |
| Hospitality | Volume and promotion driven | Low per customer | Lower, mostly digital |
The pattern is consistent: industries built on trust, meaning healthcare, law, and finance, invest more heavily in print than industries selling commodity products. When someone chooses a doctor or dentist, the physical quality of your materials signals the quality of your care.
For a wider view of how sectors allocate marketing resources, browse the full collection of industry marketing statistics, where healthcare sits alongside every vertical we track.
Myths vs facts
What practices assume about patient outreach
A few myths keep practices from running print that would pay off. The pairs below set each common assumption against what the healthcare marketing statistics actually show, so you can plan on evidence rather than habit.
Print is dead in healthcare.
Direct mail response rates in healthcare run 3 to 5 percent, well ahead of email in the same sector, because patients trust materials they can hold.
Digital is the only channel worth funding.
Digital takes the largest share, yet print and direct mail still hold 15 to 25 percent of healthcare budgets for local patient acquisition.
Patient acquisition cost is fixed.
Referral programs and print based retention drop the cost per patient far below the 150 to 350 dollar average for cold acquisition.
A cheap brochure works as well as a premium one.
Patients read print quality as care quality, so thin stock in a medical setting quietly undercuts trust before a word is read.
Print it
The print pieces healthcare marketers reach for most
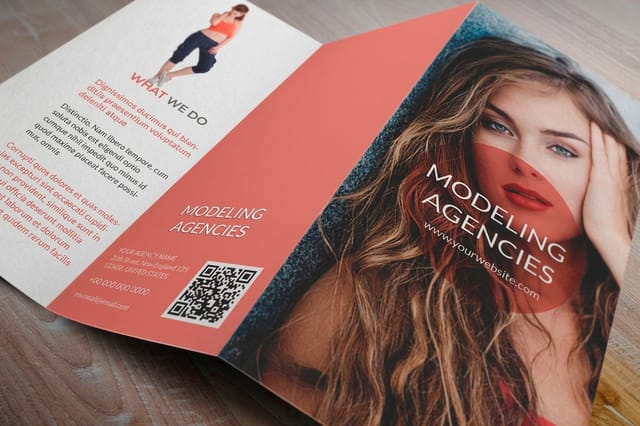
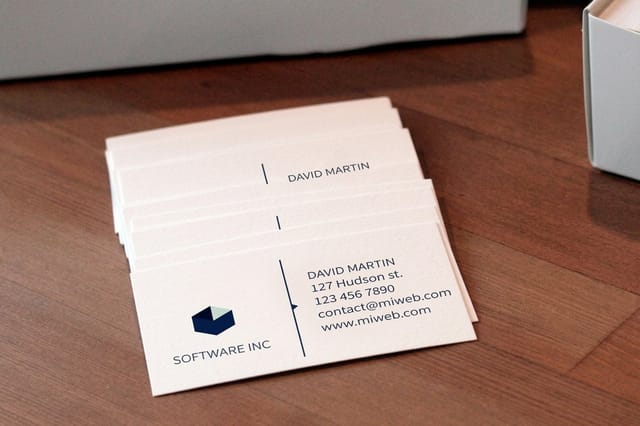
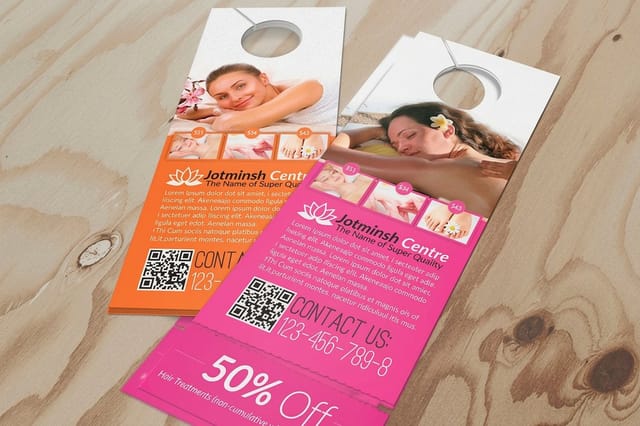
Patient outreach is a format decision. Standard Brochures print 50 for $57.11 in 3 business days, door hangers 250 for $290.41 in 7, and postcards 50 for $16.48. These are the pieces practices order when they run a recall or a new patient campaign.



What our print data reveals
What 4OVER4 order data says about healthcare orders
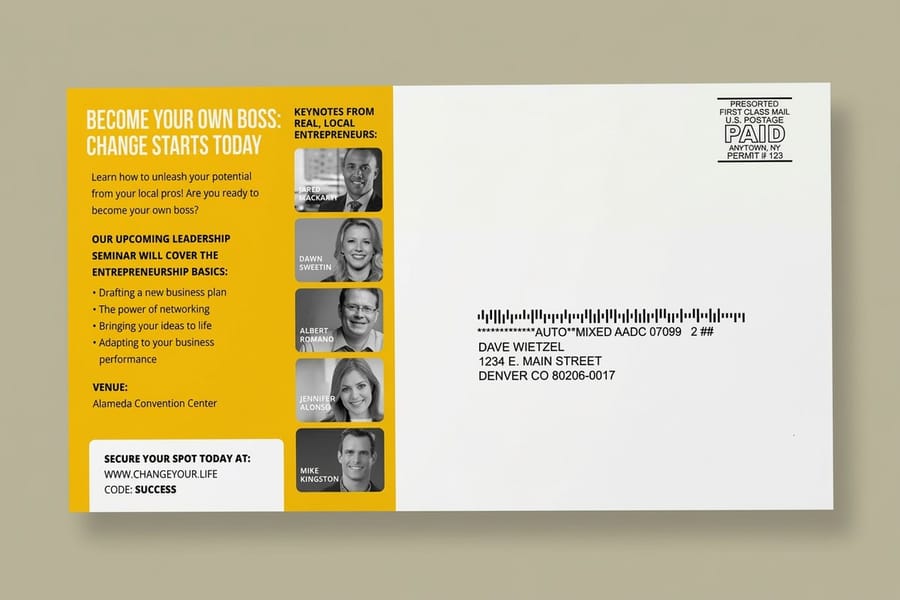
Third party reports are useful, but our own order data adds a layer they cannot. With 10 billion plus cards printed over 25 plus years, we see healthcare ordering patterns that reflect real marketing behavior.
Medical and dental practices order in steady cycles. Appointment cards and business cards reorder quarterly, brochures and patient education spike in the first and third quarters, and direct mail postcards run heaviest in January for new year health goals and September for back to school physicals and checkups.
Healthcare clients also reach for premium stock more than the average customer, choosing thicker coated paper at a higher rate. That tracks with the trust and quality link that runs through this whole page. If your practice serves younger patients, our kids printing collection makes waiting rooms friendlier.
The recall postcards and welcome folders from 4OVER4.COM made our practice feel established from day one. New patient calls climbed within the first month.
Verified customer, Practice Manager
Why practices trust us
The press behind these patient outreach figures
Every benchmark on this page sits on a long record of getting healthcare print right. A 4.8 out of 5 average across 10,000 plus reviews, 150,000 plus businesses served, and print since 1999 are the trust signals behind the numbers, so you can plan a campaign knowing the pieces land sharp and on time.
How we built this
How we compiled these healthcare data points
Every healthcare marketing statistic on this page comes from published industry research, government health expenditure data, marketing platform benchmarks, or 4OVER4.COM internal order and review data spanning 25 plus years. We cross reference multiple sources before including any data point, and where figures vary we present ranges rather than false precision. This page is updated as new research becomes available.

Get Started
Print 50 patient brochures for $57.11 in 3 business days
Pick a piece, drop in your design or a free template, and we will print it sharp on premium stock and ship it on time.
Legal Disclaimer
Gold Standard guarantees apply to all standard orders placed through 4over4.com. Price match requires verifiable proof of a competitor's published price for an equivalent product with matching specifications and turnaround time. Satisfaction guarantee covers manufacturing defects and print quality issues. Contact support with order number and documentation. On-time delivery rate based on tracked orders 1999 to 2026. Individual results may vary based on shipping carrier performance.
Explore more
Healthcare marketing guides, print products and benchmarks
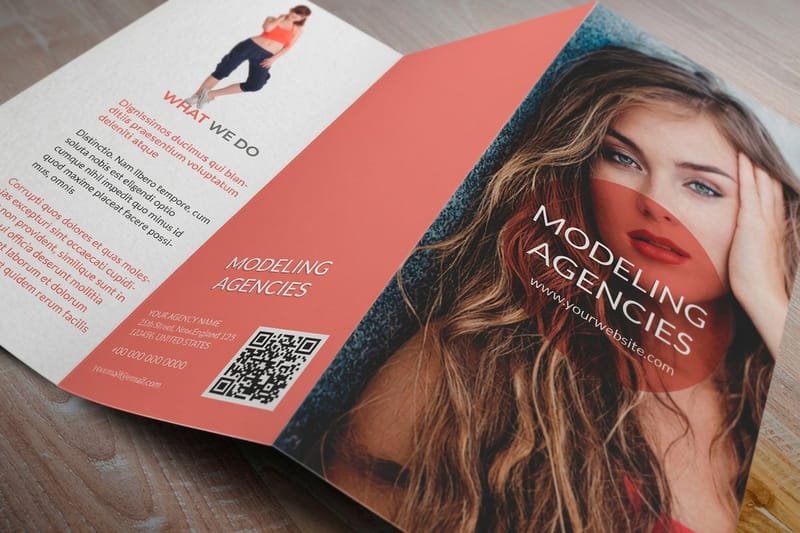 Product Patient Brochures Print the piece that carries patient education and lifts retention.
  Product Recall Postcards The direct mail format healthcare practices reorder most.
  Product Practice Flyers Announce services and campaigns to your local patient base.
  Statistics Real Estate Marketing How another hyperlocal industry allocates its budget.
  Statistics Law Firm Marketing Trust driven marketing patterns that mirror healthcare.
  Statistics Restaurant Failure Rate Why early local marketing helps a business last.
  Statistics Wedding Industry Data A useful contrast in print and digital spend. Hub Industry Statistics Benchmark healthcare against every industry we track.
  Tool QR Code Generator Track which printed pieces drive appointment calls.
  FAQs Printing FAQs Answers on stock, sizes, proofs, and mailing turnaround.
 Questions and answers
Common questions about healthcare marketing data
Budgets, dental versus general, acquisition cost, hospitals versus private practices, direct mail, and channel ROI, answered.
What percentage of healthcare marketing budgets goes to print?
Most practices put 15 to 25 percent of their total marketing budget into print, covering direct mail, brochures, appointment cards, and branded office supplies. Practices focused on local patient acquisition spend more on print because it delivers strong response in geographic targeting, where it consistently outperforms digital for local reach.
How do dental marketing statistics differ from general healthcare?
Dental practices face higher local competition and lean harder on online reviews. They typically spend 5 to 10 percent of revenue on marketing, versus 2 to 5 percent for many general providers, and they use more in office print to promote elective services like whitening and clear aligners. The dental decision is more consumer driven than hospital based care.
What is the average patient acquisition cost in healthcare?
Patient acquisition costs range from 150 to 350 dollars depending on specialty, location, and channel mix. Specialists in cosmetic surgery or orthodontics sit at the high end, while referral based acquisition is the cheapest path. Print referral cards and outreach materials support those lower cost strategies, and a QR code on printed pieces shows which ones drive appointments.
Are medical marketing statistics different for hospitals versus private practices?
Yes. Hospitals spend far more on brand awareness across television, digital, and print, while private practices focus on direct response through postcards, local search, and paid ads. Private practices tend to earn better returns per dollar from targeted local campaigns, while hospitals need broad reach to hold market share across service lines.
How effective is direct mail for healthcare advertising?
Healthcare direct mail response rates land between 3 and 5 percent, well above email in the same sector. Mail works especially well for new practice announcements, seasonal campaigns, and patient reactivation, and its physical nature creates a trust signal digital ads cannot match. Request free samples to feel the stock before you commit to a run.
Which healthcare marketing channels have the highest ROI?
Physician referral programs top the list, since a referred patient costs almost nothing and carries a higher lifetime value. Search improvement and direct mail compete for second depending on the practice, and paid search delivers fast at a higher ongoing cost. The smartest mix pairs a mailer with a QR code that drops patients onto an online booking page.
