
Digital Signage Statistics That Shape 2026 Strategy


Market size, ROI, retail impact, and effectiveness data, set against 25 plus years of printing banners and signage at 4OVER4.
Digital signage is growing fast, but printed signage is not going anywhere. Screens win on real time updates and recall, printed banners win on cost per impression and tactile impact, and the businesses that track both allocate budgets smarter. With 150,000 plus businesses printing signage with 4OVER4.COM, the order data backs the hybrid approach the numbers point to.
Signage in short
What the signage data says about screens against print
Digital signage statistics reveal a fast expanding industry where screens are replacing static displays across retail, hospitality, healthcare, and corporate spaces. The data below covers market size, adoption, consumer engagement, and return on investment, so you can build a case for a screen, a printed banner, or the hybrid most businesses land on. 4OVER4.COM has printed for 150,000 plus businesses, and many now run displays alongside their printed collateral for maximum reach.

By the numbers
Recall, dwell, and payback in four signage numbers
Here are the headline figures marketers reach for first when they plan signage, drawn from industry benchmarks and our own production record. Screens keep gaining share, but printed banners and posters still carry the outdoor and long run work. Set those benchmarks against 25 plus years of printing signage at 4OVER4.COM and the picture is consistent: the smartest plans use both.
Why it matters
Why signage industry statistics matter right now
Digital signage statistics are not just numbers on a slide. They show screens spreading across retail floors, hospital corridors, hotel lobbies, and office entrances, replacing static displays that once sat untouched for months. 4OVER4.COM has printed signage and banners for 150,000 plus businesses, and many of those same clients now run displays next to their printed pieces.
The reason the data matters is budget. When you can see where signage spending is heading, you allocate smarter, whether you invest in screens, printed banners, or both. For the wider print picture, our printing industry statistics set the context, and the business card statistics breakdown shows how one product category is trending.
Businesses planning a hybrid rollout often start a custom project so their screens and their printed collateral carry one message across every touchpoint.
Market size
Market size, growth, and adoption rates
The digital signage market has grown from a niche technology into a mainstream channel, expanding into the tens of billions of dollars globally with steady double digit projections through the end of the decade. North America and Asia Pacific lead adoption, and Europe and Latin America are closing the gap fast.
Three forces drive the climb. Commercial display costs have dropped sharply, cloud based software lets even small teams manage content across many screens, and faster connectivity enables real time updates where wired internet is not practical. Broader advertising research from Forbes tracks how ad revenue keeps migrating toward digital platforms, while out of home category data from Statista maps where outdoor spending concentrates.
For anyone tracking visual communications budgets, these growth numbers signal where money is heading. If you follow packaging industry statistics or other format trends, digital signage is a category you cannot leave out of the plan.
Retail
Retail signage statistics and where screens dominate

Retail is the single largest vertical for digital signage. Grocery chains, fashion stores, quick service restaurants, and big box retailers all lean on in store screens to promote time sensitive offers, highlight new arrivals, and shorten the perceived wait at checkout.
Quick service restaurants were early and aggressive adopters because digital menu boards let them change pricing, push combos, and feature seasonal items without reprinting anything. The savings on menu production alone can cover the hardware within a year or two.
Chains with hundreds of locations gain the most from centralized content. A corporate team pushes one promotion to every store at once, a speed and consistency that printed signage cannot match when production and shipping create delays. Even so, printed point of sale pieces still drive impulse buys right at the shelf, so the two formats split the work inside the same store.
Effectiveness
Digital signage effectiveness, engagement, and recall
Digital signage effectiveness is one of the most studied areas in out of home research. Displays consistently capture more attention than static alternatives in high traffic spaces like malls, transit stations, and lobbies, and recall rates tend to run higher because motion, color, and sound combine into something that sticks.
Attention is only half the story. The stronger signal is action. Digital signage has been linked to longer dwell time in retail, higher average transaction values, and better wayfinding in complex places like hospitals and airports. When people find what they need faster, they spend more and leave happier.
For a side by side look at how traditional print advertising holds up against digital channels, our print advertising statistics lay the engagement numbers out in full.
ROI
Digital signage benefits, ROI, and cost efficiency
Return on investment for digital signage depends on context, but the data favors screens for high traffic, high frequency messaging. Restaurants, retail chains, and corporate campuses tend to see the fastest payback, often inside 12 to 24 months.
The cost case starts with eliminating recurring print runs. A restaurant that updates its menu weekly saves thousands a year by moving to displays, and the hidden savings add up too, from less install labor to fewer errors from outdated materials to easy message testing without printing multiple versions. On the revenue side, showing high margin items during peak hours lifts upsells in food service.
The upfront spend is real though. Hardware, software subscriptions, installation, and content creation all stack up. For a business that rarely changes its message, a beautifully printed banner or poster with zero ongoing software cost often delivers better value per dollar, which is exactly why so many buyers run both.
Digital vs print
Digital versus print signage, a data-driven comparison

The digital versus print debate is mostly settled. Both formats have distinct strengths, and the most effective strategies use them together. Digital excels at active, time sensitive, and interactive content, while print excels at permanence, tactile impact, and cost efficiency for low frequency messaging.
4OVER4.COM sees this firsthand. A trade show exhibitor runs product demos on a screen and hangs a printed retractable banner for branding. The printed piece gives someone something physical to take away, and the display grabs attention from across the room. Neither format alone does the full job.
Physical formats keep strong consumer engagement even in a digital first world. Our greeting card industry statistics show how tactile print holds its ground, which is the same pattern that keeps printed signage relevant next to every screen.
Order data
What 4OVER4 order data reveals about signage trends
Third party reports are valuable, but our own order data adds a layer they miss. Drawn from 150,000 plus businesses and 10,000 plus reviews at a 4.8 out of 5 average, the pattern is clear. Businesses are not abandoning print for digital. They are ordering both.
Customers who buy printed banners and large format signage frequently note that they are pairing those pieces with displays at events, storefronts, and trade shows. We also see digital investment change print timing, with screen rollouts followed by printed materials for outdoor events, pop ups, and mail campaigns that drive traffic to the digitally equipped location.
That convergence is the real headline behind the signage industry statistics. Print and digital are not competing, they are merging into one visual communications strategy, and the quality of the printed half still decides whether your brand looks sharp next to a crisp screen.
Industry verticals
Where digital signage grows fastest
Beyond retail, several industries drive digital signage adoption at scale. Each has its own content needs, refresh cycles, and return expectations, but the common thread is real time information in a public space.
| Vertical | How they use it |
|---|---|
| Retail | Screens promote time sensitive offers, new arrivals, and shorter perceived checkout waits. |
| Healthcare | Displays handle wayfinding, patient education, and live wait time updates. |
| Corporate | Lobbies and meeting rooms run internal comms, welcome screens, and room booking. |
| Transportation | Airports and terminals show schedules, advertising, and emergency notices. |
| Education | Campuses post announcements, event promotion, and campus navigation. |
| Hospitality | Hotels and resorts run concierge info, event schedules, and lobby promotions. |
Make it perform
Content strategy and signage performance
Not all digital signage performs equally. Content quality and strategy have a huge impact on results. A static image on a digital screen does not perform much better than a printed poster, so the real gains come from motion graphics, video, data driven personalization, and interactive touch elements.
Refresh frequency matters too. Displays that loop the same content for weeks lose attention, while the best networks update daily or hourly based on time of day, weather, or audience. This is where many small businesses stumble, investing in hardware but underinvesting in content. A costly display running a weak slideshow will not beat a well printed poster, because the medium is only as good as the message.
Side by side
How digital and print signage stack up by the numbers
Digital signage statistics get most useful when you compare formats directly. The strengths of each channel depend on your goals, budget, and how often the message changes. 4OVER4.COM works with 150,000 plus businesses that use both, and the patterns are consistent.
| Format | Trust and feel | Response and recall | Cost | Trackable |
|---|---|---|---|---|
| Digital signage | Real time, motion, interactive | Higher recall in high traffic spaces | Higher upfront, lower per update | Yes, built in analytics |
| Printed signage | Permanent, tactile, credible | Strong at the shelf and outdoors | Lower upfront, new run per change | Yes, with codes and QR |
| Static image on a screen | Looks digital, reads flat | Barely beats a printed poster | Wastes the hardware spend | Limited |
Digital wins on flexibility and real time updates. Print wins on cost per impression for long term placements and tactile brand impact. Neither is universally better. The use case decides, and the total cost of ownership over 12 months tells the real story rather than the upfront price alone.
For a broader view of how the entire print industry statistics landscape compares to digital channels, that hub breaks down market share, growth rates, and consumer preference across formats. The businesses that track both channels and set budgets on data, not assumptions, consistently get better results than those locked into one format.
Myths vs facts
What buyers get wrong about screens versus printed signs
A few myths steer signage budgets the wrong way. The pairs below set each common assumption against what the signage statistics actually show, so you can plan on evidence rather than habit.
Digital signage has made printed signage obsolete.
The data shows the two converge. Businesses that buy printed banners frequently pair them with screens at the same location.
A screen always beats a printed poster.
A static image on a screen barely outperforms a printed poster. The gains come from motion, video, and fresh content, not the hardware alone.
Digital signage is always cheaper than print over time.
For low frequency messaging, a printed banner with zero software costs often delivers better value per dollar than a display.
Only retail benefits from digital signage.
Healthcare, corporate, transportation, education, and hospitality all drive adoption, each with different content needs and refresh cycles.
Wally turns the signage data into your next rollout
Screens and print are not rivals. They are teammates.
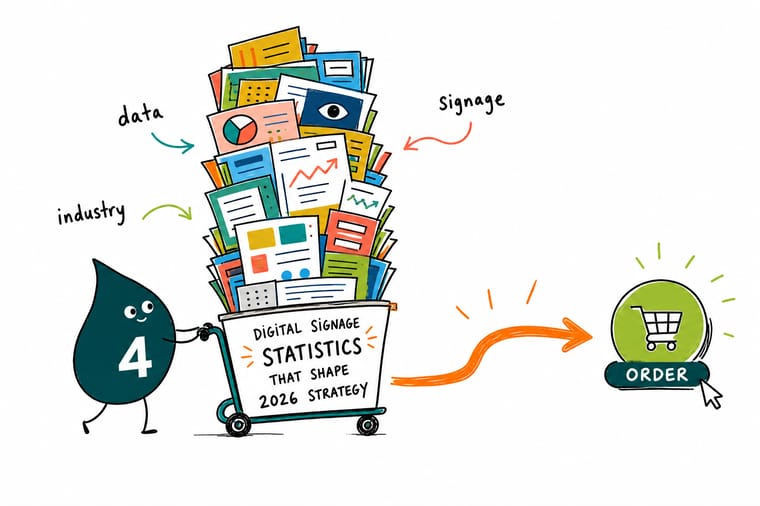
The numbers all point one way: a screen grabs attention across the room, and a printed banner gives someone something real to keep. Wally's rule is simple. Run displays where the message changes often, print banners for outdoor and long runs, and let the two reinforce each other at the same location. Vinyl banners are the fastest way to put the printed half of this data to work.
Order vinyl banners →Print it
The signage products businesses reach for most
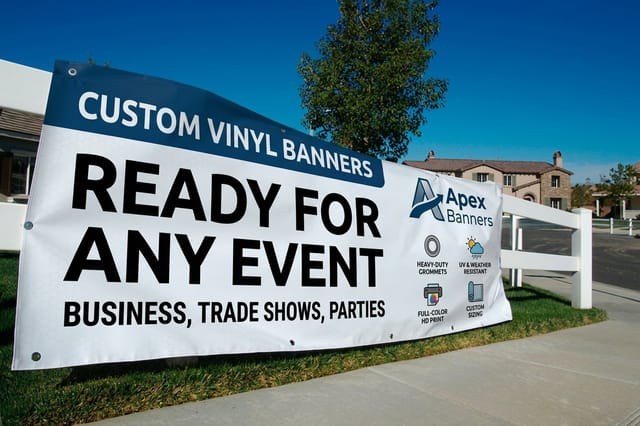
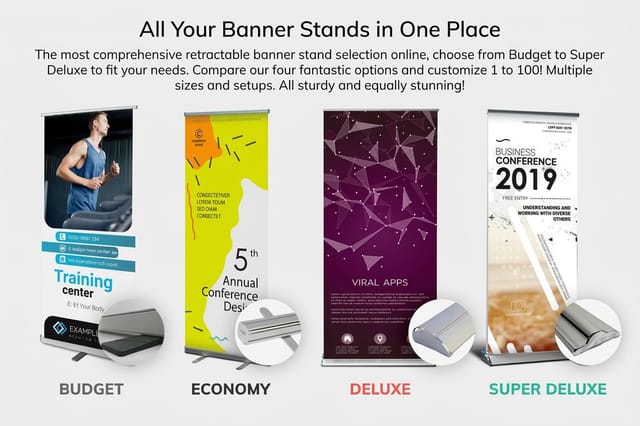
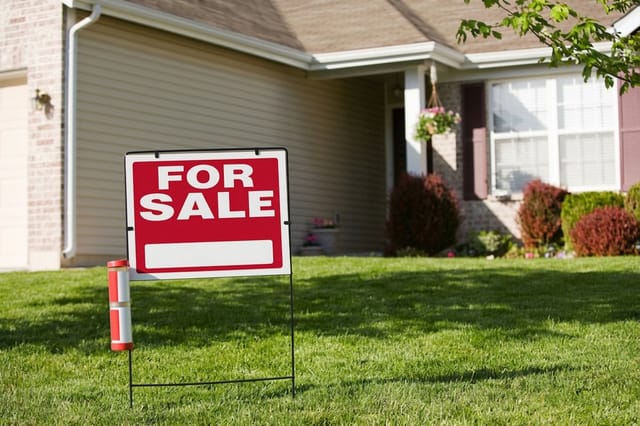
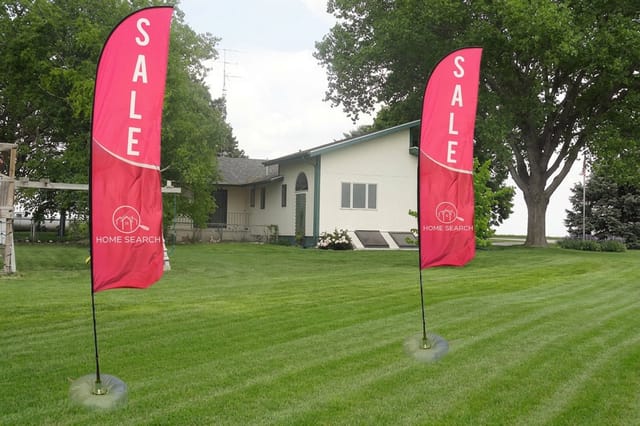
Knowing the signage statistics is step one. Printing the physical pieces that work alongside your screens is step two, and it starts with the right product. Here are the signage formats businesses reach for most when they put these numbers to work.


Stock, finishing and price
Vinyl banner pricing and specifications
Vinyl banners print in 3 business days and hold up outdoors, and the table below lists every size and finish so you can match the material to where the banner will hang.
| Quantity | Price Per Unit | Total |
|---|---|---|
| 1 | $79.00 | $79.00 |

Start from a blank
Templates and samples to start from
Need a head start? Grab a blank signage template with bleed and safe margins already built in, or order free samples to feel the materials before you print a full run.
Proof, not promises
What our banner and sign runs show on material and speed
Here are the quality and volume signals from our side of the press, the figures that round out the picture for anyone planning signage in 2026 and beyond. A 4.8 out of 5 rating across 10,000 plus reviews shows the print quality holds up piece after piece, and same day options on select products keep a tight event timeline on track.
Why marketers trust us
The banner printing record behind these signage figures
Every benchmark on this page sits on a long record of getting signage printed right. A 4.8 out of 5 average across 10,000 plus reviews, 150,000 plus businesses served, and signage printed since 1999 are the trust signals behind the numbers, so you can plan a rollout knowing the printed pieces will land sharp and on time.
Where we fit
Where 4OVER4.COM fits in the signage landscape
Digital signage statistics paint a picture of a growing market, but printed signage is not going anywhere. 4OVER4.COM has built its reputation on 1,000 plus products that include banners, posters, signs, and large format prints, the physical materials that work alongside every screen.
When you need printed signage fast, we offer same day printing on select products, which matters when you are setting up for an event tomorrow and your screens need printed companions. Our 10,000 plus reviews at a 4.8 out of 5 rating reflect the quality businesses expect when their printed pieces sit next to a crisp display, because a flimsy banner next to a sharp screen looks worse than no banner at all. Need something produced quickly? Same day printing gets your order out the door fast.
How we built this
Where these signage figures come from
The digital signage statistics on this page come from published industry reports, market research firms, trade association data, and 4OVER4.COM's own order data spanning 25 plus years in print. We cross reference multiple sources before including any data point, and we update the page as new figures become available. Where exact numbers are proprietary, we reference the ranges and trends reported by credible third party sources.

Get Started
Print vinyl banners in 3 business days
Pick a format, drop in your design or a free template, and we will print it sharp on premium material and ship it on time.
Legal Disclaimer
Gold Standard guarantees apply to all standard orders placed through 4over4.com. Price match requires verifiable proof of a competitor's published price for an equivalent product with matching specifications and turnaround time. Satisfaction guarantee covers manufacturing defects and print quality issues. Contact support with order number and documentation. On-time delivery rate based on tracked orders 1999 to 2026. Individual results may vary based on shipping carrier performance.
Explore more
Banner and sign products, print statistics, and samples
 Product Vinyl Banners Print the outdoor signage workhorse on heavy, weatherproof material.
 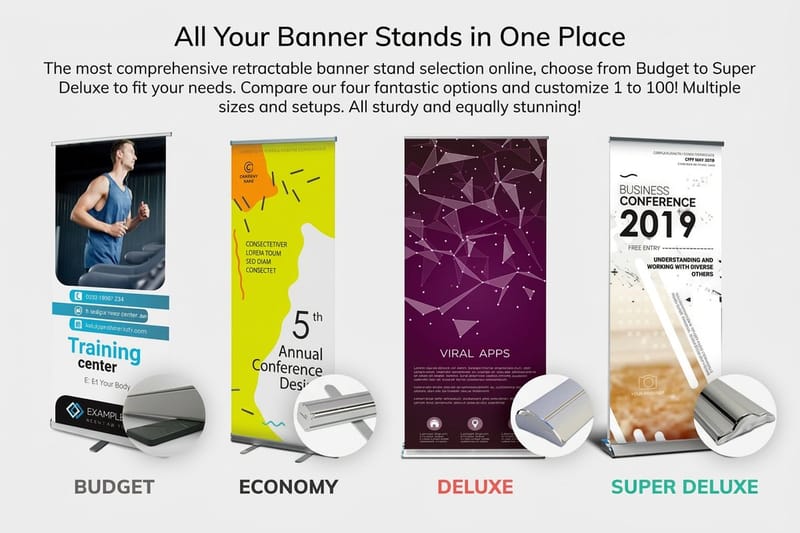 Product Retractable Banners Portable displays that set up in seconds for events and lobbies.
 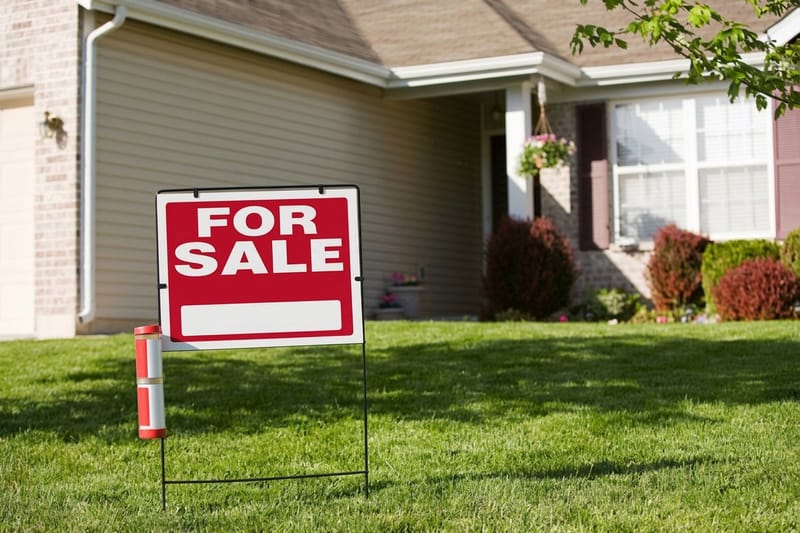 Product Yard Signs Coroplast signs for real estate, campaigns, and local promotions.
  Statistics Print Advertising Statistics The engagement and recall research behind the numbers.
  Statistics Printing Industry Statistics Market share, growth, and consumer preference across formats. Hub Print Industry Statistics The full statistics hub this page reports into.
  Shop Signs and Banners Browse every signage and banner product in one place.
  Samples Free Print Samples Feel the materials and print quality before you order.
  Statistics Greeting Card Statistics How tactile print keeps strong engagement in a digital world.
 Questions and answers
Common questions about signage data and performance
Market growth, effectiveness, verticals, ROI, and print versus digital, answered.
What do digital signage statistics tell us about market growth?
They show steady year over year expansion, driven by lower hardware costs, cloud based content management, and rising adoption across retail, healthcare, corporate, and transportation. Most projections point to continued double digit growth through the end of the decade as more businesses move from static to active displays.
Does digital signage outperform printed signage?
It depends on the setting. Effectiveness data shows higher recall and engagement for screens in high traffic spaces, but printed signage delivers better cost per impression for long term placements and a tactile feel screens cannot copy. The strongest strategies use both formats together.
Which industries rely most on digital signage?
Retail leads, followed by quick service restaurants, healthcare, corporate offices, transportation hubs, and education. Each vertical uses signage differently, so retail focuses on promotions, healthcare on wayfinding, and corporate on internal communications.
What is the typical ROI timeline for digital signage?
Payback periods usually run 12 to 24 months for high traffic deployments like restaurants and retail chains. Businesses with frequent content changes reach ROI faster because they cut recurring print costs, while low frequency messaging may not justify the hardware. Order free samples before you commit to compare printed options first.
How do retail signage statistics compare between digital and print?
Retail data shows digital displays capture more attention in store, yet printed point of sale materials still drive impulse purchases at the shelf. Digital menu boards cut reprinting in food service, while printed banners and posters stay effective for storefronts and outdoor spots where screens face weather and glare.
Is digital signage replacing print entirely?
No. The statistics show print and digital converging, not competing. Our order data confirms it, since businesses buying printed vinyl banners and signage frequently pair them with displays. The hybrid approach beats either channel on its own.
