
Print Advertising Statistics That Prove ROI in 2026


Response rates, billboard reach, flyer data, and door hanger numbers, set against the order data behind 25 plus years of printing at 4OVER4.
Print advertising still drives real results in a screen-saturated world. Direct mail response beats email, billboards reach more than 90 percent of U.S. adults weekly, and 82 percent of consumers trust print ads when they buy. With 150,000 plus businesses printing with 4OVER4.COM and 10 billion plus cards produced, the data backs up what marketers already feel: print works.

The advertising numbers
What the latest print advertising statistics tell us
Print advertising statistics tell a clear story. Physical marketing materials still drive real results in a screen-saturated world, and they command attention that digital ads struggle to match. From direct mail to billboards, the numbers show stronger brand recall, higher trust, and better engagement than many digital-only campaigns. 4OVER4.COM has printed 10 billion plus cards and served 150,000 plus businesses, which gives us a front-row seat to how print performs across every industry.
By the numbers
Print advertising performance at a glance
Here are the headline figures marketers reach for first when they plan a print campaign, drawn from recognized industry research and our own production data. Direct mail response runs near 9 percent on house lists, billboards reach most U.S. adults every week, and print earns the highest trust rating of any advertising channel. Set those benchmarks against 25 plus years of printing at 4OVER4.COM and the picture is consistent: the pieces people can hold get acted on.

Why it still matters
Why print advertising statistics still matter in 2026
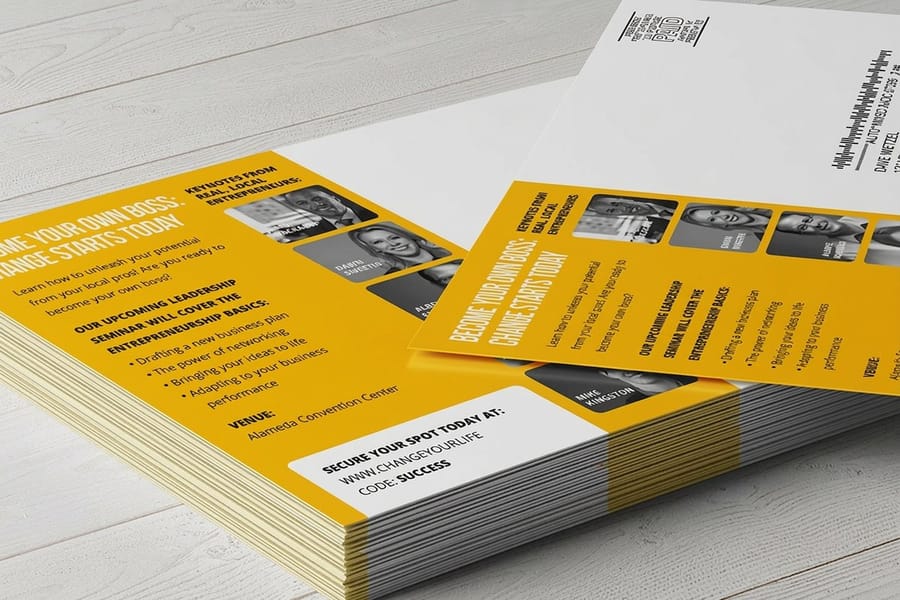
Print advertising statistics are not trivia for marketing nerds. They are decision-making tools. Every dollar you put into flyers, door hangers, postcards, or billboards should be backed by data instead of guesswork, and the numbers keep pointing the same way. Physical advertising builds stronger brand recall, higher trust, and better engagement than many digital-only campaigns.
This page pulls together the most useful print advertising effectiveness statistics across formats, industries, and channels. You will find data on direct mail ROI, out of home reach, and how print stacks up against digital. For the bigger picture, our Printing Industry Statistics page sets the context, and if you want to see how print's most iconic format is doing, the Business Card Statistics report has the latest numbers.
4OVER4.COM has printed 10 billion plus cards for 150,000 plus businesses since 1999, which gives us a front-row seat to how print performs across industries. For billboard reach or flyer response rates, the data backs up what smart marketers already know. Print works, and our Printing Industry Statistics hub adds even more context.
Response and ROI
Direct mail response rates and ROI
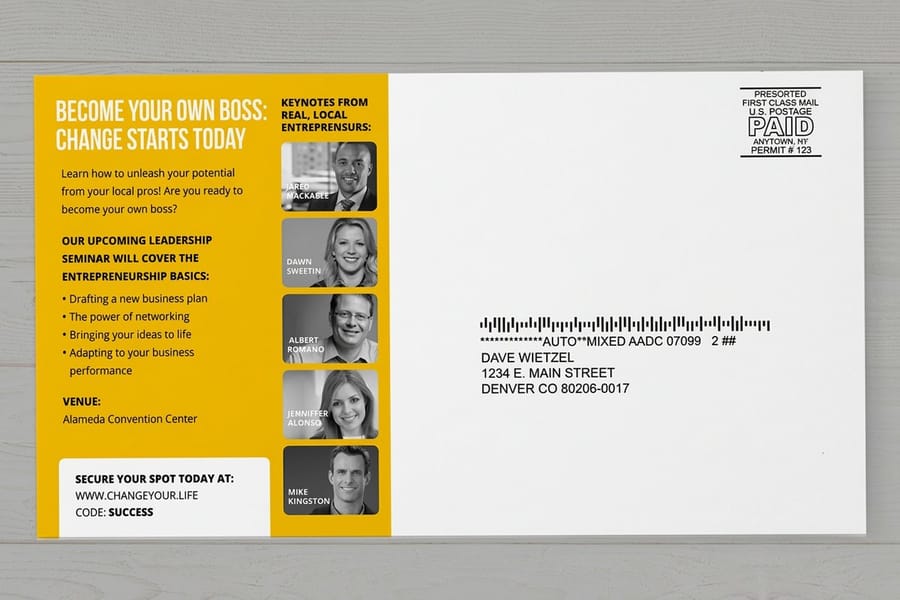
Direct mail is one of the strongest performers in print advertising. According to the Association of National Advertisers, direct mail response rates for house lists average around 9 percent, far above the typical email response rate of roughly 1 percent. That gap matters the moment you start calculating cost per acquisition.
The reason is simple. People open physical mail. They hold it, read it, and often keep it on the counter or the desk for days. A postcard does not get buried under 47 unread emails. It sits on the kitchen table next to the coffee mug, which is exactly why response holds up.
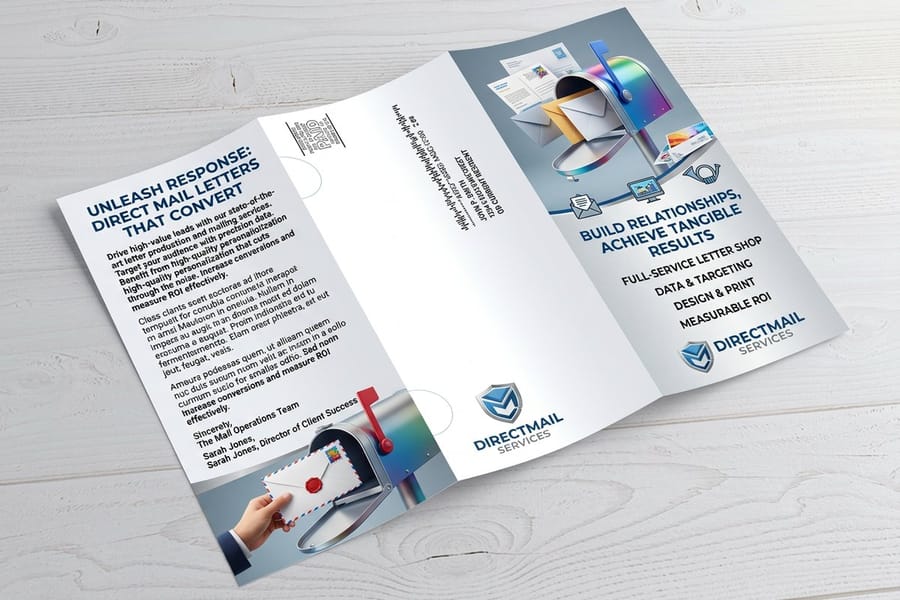
For businesses exploring new formats, 3D Postcards add a tactile element that can push response even higher. The novelty factor alone gets people to stop and look.
We switched from email-only campaigns to a mix of postcards and digital follow-ups. The difference in customer response was immediate and measurable.
Rachel K., Marketing Director
Out of home reach
Billboard statistics and out of home performance
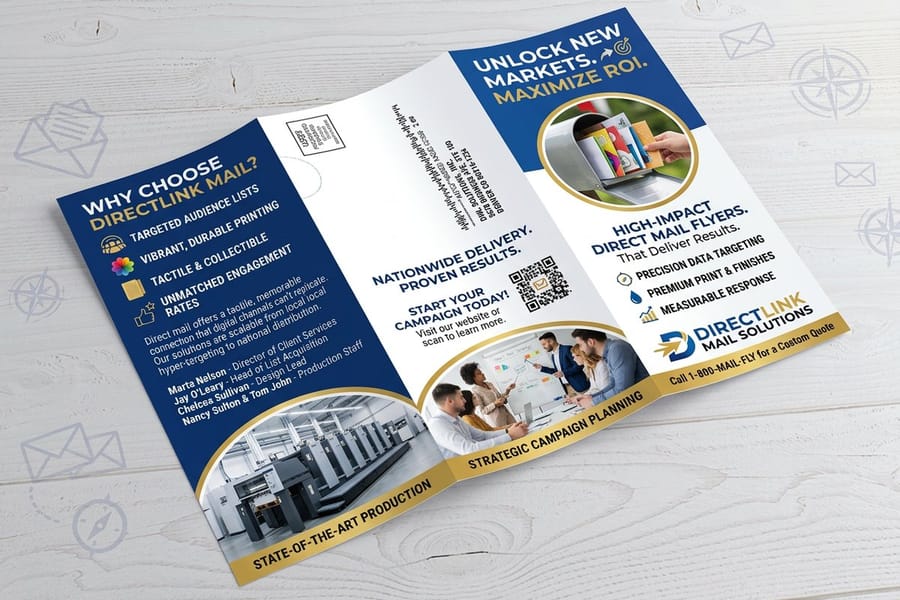
Billboard advertising statistics show that out of home media reaches more than 90 percent of the U.S. population every week, according to the Out of Home Advertising Association of America. No single digital platform matches that kind of weekly reach.
The recall numbers are just as strong. Studies from Nielsen and the OAAA show that nearly 80 percent of consumers notice out of home ads, and about 60 percent have taken action after seeing one, whether that means visiting a website, searching for the brand, or walking into a store. Billboards work because they are impossible to skip, block, or scroll past. You cannot install an ad blocker on your windshield.
The cost efficiency is worth noting too. Billboard cost per thousand impressions often runs between $2 and $9, one of the most affordable awareness channels available. Compare that to digital display, where the cost per thousand can easily hit $10 to $30 and up depending on targeting.
Small format, big impact
Flyer advertising statistics
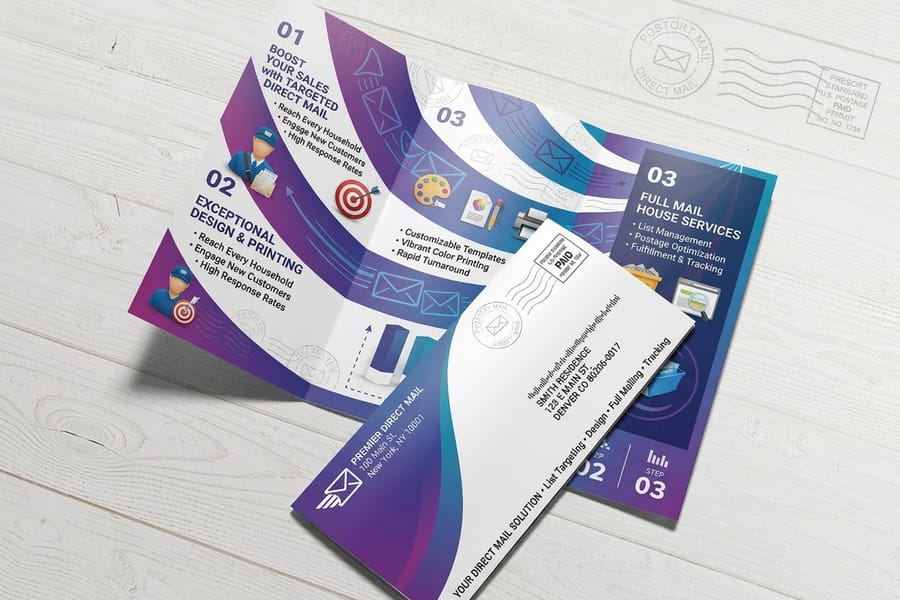
Flyers do not get enough attention. They are one of the most accessible print formats, cheap to produce, easy to distribute, and effective at the local level. Research from the Data and Marketing Association shows that 79 percent of consumers act on direct mail immediately, compared to only 45 percent who say they deal with email right away.
Flyers fall into that direct mail bucket. When someone picks up a flyer at a coffee shop or finds one on the door, they read it now, not later. For small businesses, restaurants, event promoters, and service providers, flyers remain a go-to format. The cost per piece can drop below a few cents at higher quantities, and the local targeting is unbeatable because you put flyers exactly where your customers are.
Targeted placement
Door hanger advertising statistics
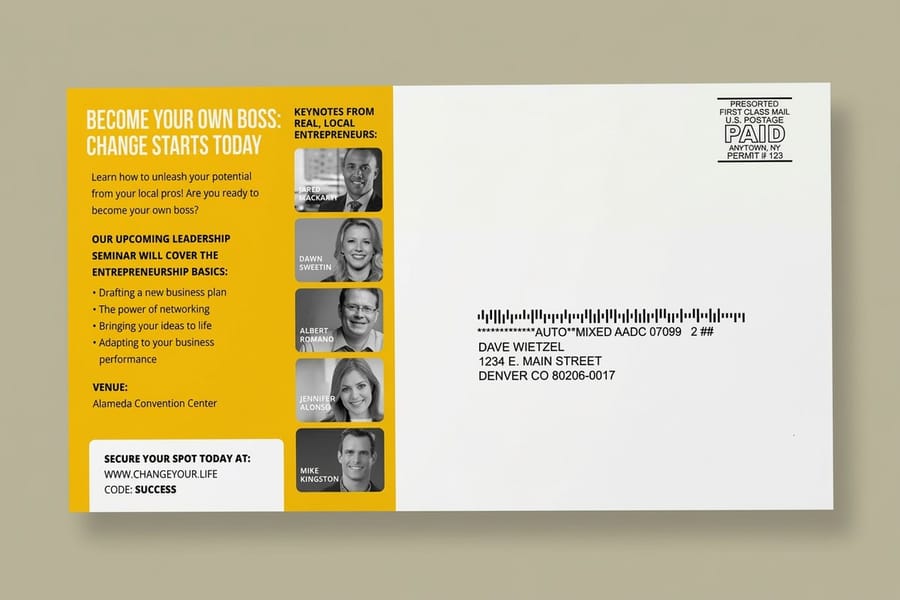
Door hangers highlight one of print's most targeted formats. They are placed literally on someone's front door. There is no mailbox clutter, no spam folder, and no competing ads on the page. According to industry data, door hangers see response rates between 1 and 5 percent depending on the offer and the market.
That might sound modest until you factor in the cost. At pennies per piece for printing and minimal distribution costs, even a 2 percent response can deliver strong ROI for home service businesses, real estate agents, and local retailers. The physical placement creates urgency too. A door hanger feels personal because it was placed there deliberately, not mass-mailed to a zip code, and that perception drives higher engagement.
Trust and recall
Print versus digital on trust and engagement
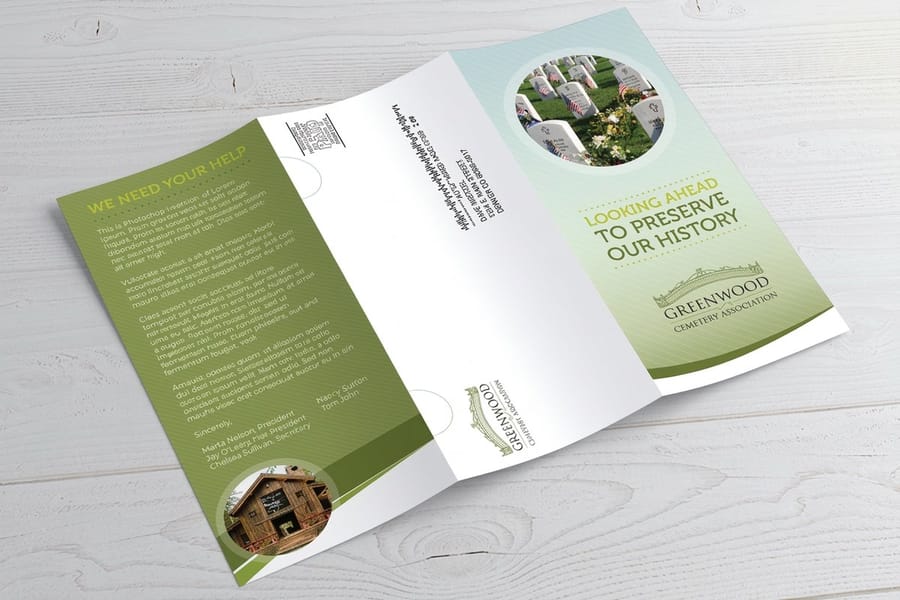
One of the most telling print advertising statistics involves trust. A 2024 MarketingSherpa study found that 82 percent of consumers trust print ads when making a purchase decision. That is the highest trust rating of any advertising channel, above TV, above social media, and well above online pop-ups.
Why does print earn that trust? Print feels real. You can touch it, and it does not disappear when you refresh the page. It also does not carry the baggage of data tracking and retargeting that follows digital ads around. Print drives stronger recall too. Neuroscience research from Canada Post and Temple University found that physical media takes 21 percent less cognitive effort to process than digital media, so people understand it faster and remember it longer.
For marketers running multi-channel campaigns, the takeaway is clear. Print is not a replacement for digital. It is the anchor, the thing people remember after the screens turn off.
Spending trends
Print advertising spending trends

Global print advertising spend has stabilized after years of decline. According to Statista, worldwide print ad revenue was approximately $50 billion in 2024, with direct mail, newspapers, and magazines making up the bulk. That is down from the early 2000s peaks, but the rate of decline has slowed dramatically.
In some segments, print spending is actually growing. Direct mail volumes have ticked up as marketers rediscover how well it performs. Our Packaging Industry Statistics page shows similar growth in printed packaging, another area where physical media drives consumer behavior. The Greeting Card Industry Statistics reflect the same trend, because people still value the physical experience of giving and receiving something tangible.
Better together
Print advertising in multi-channel campaigns
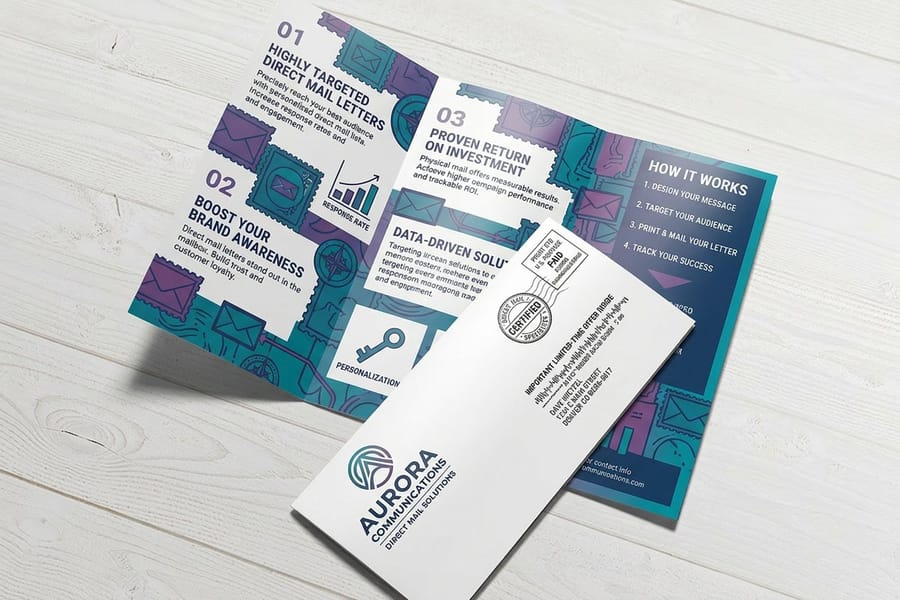
The smartest marketers do not choose between print and digital. They use both, and the data supports it. According to the ANA, campaigns that combine direct mail with digital channels see a 28 percent higher conversion rate than digital-only campaigns. Adding a printed touchpoint to an email sequence, a social campaign, or a paid search effort creates multiple contact points that reinforce the message.
Think about it from the customer's perspective. They see your Instagram ad, then a postcard arrives in the mailbox, then a follow-up email lands. Each touchpoint builds on the last. The print piece, the one they can hold, stick on the fridge, or hand to a friend, often becomes the tipping point. 4OVER4.COM has printed over 10 billion plus cards across every format imaginable, which gives us real insight into what is trending and where the growth is.
Sustainability
Environmental perception and print
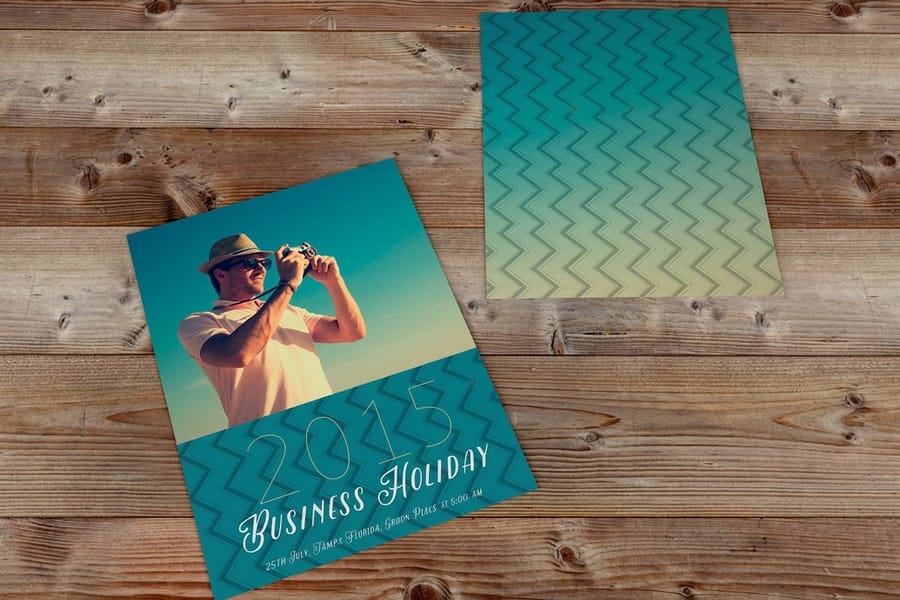
One common objection to print advertising is environmental impact, but the data is more encouraging than most people realize. The paper industry has made real progress on sustainability. According to Two Sides North America, 73 percent of paper and packaging in the U.S. is recovered for recycling, and forests in North America have actually grown by 20 percent over the past 50 years, partly driven by the paper industry replanting programs.
Print advertising on recycled or sustainably sourced paper can be a brand differentiator. Consumers increasingly prefer brands that show environmental responsibility, so choosing eco-friendly stock sends a clear message. Our Green Printing options use recycled and FSC-certified stocks for exactly this reason.
Our print data
What our print volume reveals about advertising trends
Third-party research tells one story about print advertising. Real production data from 4OVER4.COM tells another, and they line up. With 150,000 plus businesses served and 10 billion plus cards printed since 1999, we have a unique vantage point on print advertising trends. We have watched postcard orders surge during election seasons, flyer volumes spike around retail holidays, and door hanger orders cluster in spring and summer when home service businesses ramp up marketing.
The pattern is consistent. Businesses that invest in print advertising come back. In fact, 99 percent reorder after their first experience with 4OVER4.COM. That reorder rate is not just a loyalty metric, it is a print advertising effectiveness statistic in its own right. When something works, you do it again.
Side by side
How print advertising channels compare
Print advertising statistics become most useful when you line the channels up next to each other. Each format has strengths depending on your budget, audience, and campaign goals. Billboards favor reach, flyers and door hangers favor local targeting and cost efficiency, and direct mail wins on response rates and measurability. The comparison below puts them in context so you can match the format to the goal.
| Channel | Reach | Response and recall | Cost | Best for |
|---|---|---|---|---|
| Direct mail | Targeted by list or zip | About 9 percent on house lists | Higher per piece | Offers, fundraising, ABM |
| Billboards and OOH | 90 percent plus of U.S. adults weekly | 80 percent notice, 60 percent act | $2 to $9 per thousand | Broad awareness at scale |
| Flyers | Local and hand to hand | 79 percent act on print right away | Pennies per piece at volume | Local promotions and events |
| Door hangers | Placed on the front door | Between 1 and 5 percent response | Very low per piece | Home services and local retail |
| Digital display | Wide but easy to block | Low click-through, banner blindness | $10 to $30 and up per thousand | Retargeting and quick reach |
Format and industry
How each format and industry performs
Not all print advertising formats perform equally, and effectiveness varies by industry, but the trend is consistent across the board. When you put a physical piece in someone's hands, they pay attention. Match the right format to the right audience and the numbers follow.
| Format | Where it wins |
|---|---|
| Flyers | Cheap to print, easy to hand out, strong for local reach. |
| Postcards | Highest response per dollar, nothing to open, instant visibility. |
| Door hangers | Placed right on the door with zero mailbox competition. |
| Billboards | Unskippable reach, impossible to block or scroll past. |
| Brochures | Room to tell a full story for considered purchases. |
| Industry | How they use it |
|---|---|
| Home services | Door hangers and flyers blanket a service area fast. |
| Real estate | Just Listed and Just Sold postcards own a neighborhood. |
| Restaurants | Flyers and menus drive local foot traffic. |
| Retail | Postcards and billboards pair awareness with an offer. |
| Events | Flyers and posters build turnout on a small budget. |
Proof, not promises
Print advertising by the numbers at 4OVER4
Third-party research tells one story. Our own production data adds another layer, drawn from 150,000 plus businesses ordering print since 1999. A 99 percent reorder rate after the first run is a print effectiveness statistic in its own right, and a 4.8 out of 5 average across 10,000 plus reviews shows the quality holds up piece after piece.
Stock, finishing and price
Postcard costs behind the response figures above
Standard Postcards start at 50 for $16.48 and print in 3 business days. The mailing version runs 500 for $89.68 on 14pt or 16pt cover. The table lists every stock and finish behind those prices.
| Quantity | Price Per Unit | Total |
|---|---|---|
| 50 | 33.0¢ | $16.48 |
| 100 | 24.2¢ | $24.16 |
| 200 | 15.9¢ | $31.86 |
| 300 | 12.8¢ | $38.45 |
| 400 | 11.3¢ | $45.04 |
| 500 | 10.3¢ | $51.62 |
| 600 | 9.89¢ | $59.31 |
| 700 | 9.57¢ | $67.00 |

Wally turns the data into your next print campaign
Statistics are only step one. The printed piece is step two.
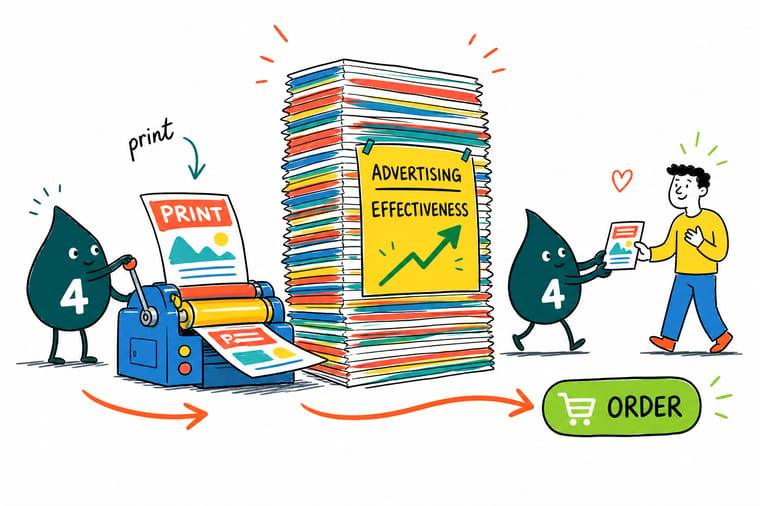
Across billboards, flyers, and door hangers the ranking holds on trust and recall. Wally's rule is simple. Pick the format that fits your goal, print it heavy on the stock that signals quality, and let the response rate do the rest. Standard Flyers start at 50 for $39.54 and Standard Postcards at 50 for $16.48, both printed in 3 business days.
Order flyers →Start from a blank
Blank templates for print advertising pieces
The templates below are drawn to the finished trim with bleed and safe margins marked, so a flyer or postcard design drops in without shifting at the cut.


Myths vs facts
Clearing up print advertising misconceptions
A few myths keep marketers from running print that would pay off. The pairs below set each common assumption against what the print advertising statistics actually show, so you can plan your next campaign on evidence rather than habit.
Print advertising is dead.
Global print ad spend sits around $50 billion a year and direct mail volumes are ticking up as marketers rediscover how well physical pieces perform.
Digital ads always beat print on results.
A 2024 MarketingSherpa study found 82 percent of consumers trust print ads when deciding what to buy, the highest trust rating of any channel.
Billboards cost too much to justify.
Out of home runs between $2 and $9 per thousand impressions, one of the cheapest awareness channels once you compare it to digital display at $10 to $30 and up.
Nobody reads door hangers.
Door hangers see response rates between 1 and 5 percent at pennies per piece, which delivers strong ROI for home service and local businesses.
Print it
The print advertising products marketers reach for most
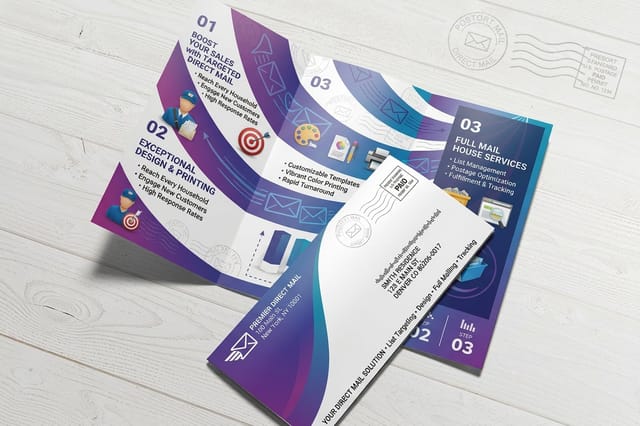
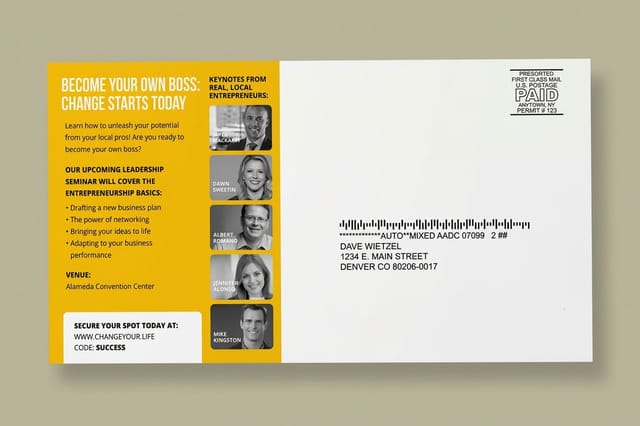
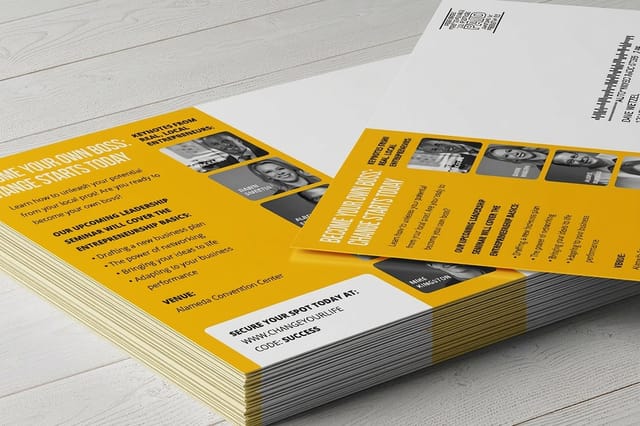
Knowing the print advertising statistics is step one. Executing a campaign that hits those benchmarks is step two, and it starts with the right piece. Here are the products marketers reach for most when they put these numbers to work.



From data to campaign
Turning print advertising data into real campaigns
Statistics are useful. Printed materials in your customers' hands are better. 4OVER4.COM bridges the gap between print advertising data and actual results by making it easy to produce marketing materials on press stock at scale. Need to act on flyer data that shows local campaigns outperform digital? Our Same Day Printing lets you launch campaigns fast.
Every order is backed by our 5 Gold Guarantees, covering quality, price match, on-time delivery, customer service, and satisfaction. With 10,000 plus reviews and a 4.8 out of 5 star rating, 4OVER4.COM has the track record to match the data. For a billboard campaign or a door hanger drop, Green Printing options keep your advertising in line with what consumers expect on sustainability.
Why marketers trust us
The print volume behind this advertising data
Every benchmark on this page sits on a long record of getting print right. A 4.8 out of 5 average across 10,000 plus reviews, 150,000 plus businesses served, and print advertising produced since 1999 are the trust signals behind the numbers, so you can plan a campaign knowing the pieces will land sharp and on time.
How we built this
How we compiled these print advertising statistics
The print advertising statistics on this page come from published research by recognized industry organizations including the ANA, OAAA, DMA, Statista, Nielsen, MarketingSherpa, and Two Sides North America. 4OVER4.COM internal data draws from 25 plus years of production records across 150,000 plus businesses. All figures reflect the most recent available data, and we update this page as new research becomes available.

Get Started
Test a flyer run: 50 for $39.54, printed in 3 business days
Standard Flyers print on 100# Gloss Text, 100# Silk Matte Text, or 70# Uncoated Text. Standard Postcards start at 50 for $16.48.
Legal Disclaimer
Gold Standard guarantees apply to all standard orders placed through 4over4.com. Price match requires verifiable proof of a competitor's published price for an equivalent product with matching specifications and turnaround time. Satisfaction guarantee covers manufacturing defects and print quality issues. Contact support with order number and documentation. On-time delivery rate based on tracked orders 1999 to 2026. Individual results may vary based on shipping carrier performance.
Explore more
Print advertising research, market data, and flyer products
Statistics Printing Industry Statistics Where the print industry stands today, by the numbers.  Statistics Printing Market Data Market size and growth trends across print segments.
  Statistics Business Card Statistics The latest numbers on print's most iconic format.
  Statistics Packaging Industry Statistics How printed packaging drives consumer behavior.
  Statistics Greeting Card Statistics Why physical cards still hold their value.
  Product Flyers Print the workhorse format of local advertising.
  Product Postcards The direct mail format with the highest response per dollar.
  Product 3D Postcards Add a tactile, eye-catching element that lifts response.
  Guides Printing Guides Step-by-step help for designing and printing your campaign.
  Free samples Free Samples Feel the stocks and finishes before you place an order.
 Questions and answers
Common questions about print advertising data
Direct mail, billboards, flyers, door hangers, and multi-channel campaigns, answered.
What are the most important print advertising statistics for small businesses?
The most actionable numbers center on direct mail response rates, which average around 9 percent for house lists, and flyer data showing that 79 percent of consumers act on physical mail right away. Small businesses need high-impact, low-cost channels, and print delivers both, especially for local targeting where digital ad costs keep climbing. Order Free Samples to feel the stock before you commit.
How do billboard advertising statistics compare to digital display ads?
Billboard cost per thousand impressions runs between $2 and $9, while digital display often runs $10 to $30 and up. Billboards also reach more than 90 percent of the U.S. population weekly, and out of home impressions are unskippable because you cannot install an ad blocker on a highway. For pure awareness at scale, billboards remain hard to beat.
Are door hanger advertising statistics strong enough to justify the format?
Yes. Door hangers see response rates between 1 and 5 percent, which is competitive given the extremely low cost per piece. Their strength is placement, directly on someone's front door with zero competition from other mail. Home service companies, real estate agents, and local restaurants see especially strong results.
Do print advertising effectiveness statistics support using print alongside digital?
Absolutely. Research from the ANA shows that campaigns combining direct mail with digital channels achieve a 28 percent higher conversion rate than digital-only efforts. Print adds a physical touchpoint that reinforces digital messaging and builds trust, so the two channels work better together than either does alone.
What flyer advertising statistics should I know before launching a campaign?
Flyers fall into the direct mail bucket, where 79 percent of consumers act on a physical piece immediately compared to 45 percent for email. The cost per piece drops below a few cents at higher quantities, and local targeting is unbeatable because you place flyers exactly where your customers already are. Print on premium stock so the piece feels worth keeping.
Is print advertising spending growing or shrinking?
Global print ad spending has stabilized at roughly $50 billion a year. While it sits below historical peaks, the decline has slowed a lot, and direct mail volumes are actually increasing as marketers rediscover print. Segments like printed packaging and promotional materials keep growing as brands look for physical touchpoints.
