
Printing Industry Statistics & Market Data for 2026


Market size, digital printing growth, response rates, and sustainability, set against the order data behind 25 plus years of printing at 4OVER4.
The printing industry is not dying. It is shifting. Some segments contract while packaging, digital, and commercial print grow fast. The global print market sits in the hundreds of billions of dollars, direct mail beats email on response, and paper stays one of the most recycled materials on the planet. With 150,000 plus businesses printing at 4OVER4.COM and 10 billion plus cards produced, the data backs what marketers already feel. Print works.
Market snapshot
What printing industry statistics tell us in 2026
The printing industry is not shrinking. It is shifting. Some segments contract while others grow fast, and digital printing, packaging, and direct mail keep gaining ground. The global printing market sits in the hundreds of billions of dollars, and commercial print still drives a huge share of marketing spend worldwide. 4OVER4.COM has served 150,000 plus businesses and printed 10 billion plus cards, and our loyalty program rewards the businesses that keep investing in physical media.
By the numbers
Printing industry data at a glance
Here are the headline figures marketers reach for first when they plan a print budget, drawn from industry benchmarks and our own production data. Packaging leads the market, digital print grows fastest, and paper recovery keeps climbing. Set those benchmarks against 25 plus years of printing at 4OVER4.COM and the picture is consistent. The pieces people can hold get acted on.

Why it still matters
Why printing industry data still matters for your business
Printing industry statistics are not just numbers on a page. They are decision-making tools. When you know the printing market size is growing in specific segments, you can put budget where it pays off. When the data shows print marketing beating digital on response, you stop guessing and start planning your next campaign around what actually works.
This page pulls together the most useful data points across commercial printing, digital printing, packaging, and direct mail. The figures come from industry associations, market research firms, and the production data 4OVER4.COM has built over 25 plus years in the business. For benchmarking a marketing spend or making the case for print, the context you need is here.
For deeper dives into specific segments, see our business card statistics and our packaging industry statistics, two of the fastest-moving corners of the print market.
Market size
The state of the global printing market in 2026

The global printing market remains one of the largest manufacturing sectors in the world. Despite years of predictions about a paperless future, businesses keep printing. They print business cards, packaging, direct mail, banners, labels, and brochures, and the reason is simple. Print gets read, held, and acted on.
According to Smithers, the global print market has been valued at more than 800 billion dollars in recent years, with steady growth projected through 2030. Packaging print leads that growth, but commercial printing statistics show real resilience across marketing materials, stationery, and promotional products too.
Commercial print
Commercial printing industry statistics

Commercial printing covers everything from business cards and flyers to catalogs and large-format signage. In the United States alone, the commercial printing sector generates tens of billions of dollars in annual revenue. The Printing Industries of America has historically reported that the industry employs hundreds of thousands of workers across thousands of establishments.
What has changed is how those shops operate. Shorter runs, faster turnaround, and online ordering have reshaped the landscape. 4OVER4.COM ships 82 percent of orders early and holds a 99.8 percent on-time delivery rate, numbers that show how modern commercial printers compete on speed and reliability rather than price alone.
For a closer look at how print advertising holds up against digital channels, see our print advertising statistics breakdown.
Digital growth
Digital printing industry statistics and growth

Digital printing is the fastest-growing segment inside the broader printing market. Unlike offset, digital presses need no plates, which means no setup cost for short runs. Variable data printing lets you personalize each piece, and turnaround drops from days to hours.
Research from Mordor Intelligence and Grand View Research projects the digital printing market to grow at a compound annual rate of roughly 5 to 7 percent through the end of this decade. The main drivers are e-commerce packaging, personalized marketing, and on-demand production.
4OVER4.COM runs both digital and offset presses, so customers get flexibility. Need 50 ultra-thick business cards for a pitch tomorrow. That is digital. Need 50,000 postcards for a regional campaign. That is offset. The data shows businesses increasingly want both options from a single provider.
We switched to short-run digital printing for our seasonal menus and cut waste by 60 percent, and the quality matched our old offset runs.
Marcus D., Restaurant Owner
Response and ROI
Print marketing statistics on response rates and ROI

Here is where print marketing statistics get interesting. The Data and Marketing Association has consistently reported direct mail response rates between 2.7 percent and 4.4 percent for house lists. Email marketing, by comparison, averages around 0.6 percent. That gap is a canyon, not a rounding error.
Print marketing does not just get opened. It gets remembered. A study by Canada Post found that direct mail takes 21 percent less cognitive effort to process than digital media. Neuroscience research from Temple University showed that physical ads produced stronger emotional responses and better brand recall than digital ads.
These numbers matter because they feed straight into return on investment. When a mailer pulls a 4 percent response against an email at 0.6 percent, the math on cost-per-acquisition shifts hard in print's favor for many campaigns.
The lesson holds across formats. A tangible piece in someone's hands earns attention that a crowded inbox cannot match, and attention is the first step toward a sale.
I used to think print was dying, then I compared our direct mail numbers to our email stats. Print beat digital by 3x on response rate, and we have tripled our print budget since.
Angela R., Marketing Director
Specialty print
The greeting card and specialty print markets
Specialty segments tell their own story inside printing industry statistics. The greeting card market alone generates billions of dollars in annual revenue in the United States. Custom invitations, announcements, and holiday cards stay popular even as digital communication piles up, because people still want something they can hold.
That tangible pull is why greeting card industry statistics show steady consumer spending in this category year after year.
4OVER4.COM offers more than 1,000 products across these specialty categories, from wedding invitations on cotton paper to holiday cards with foil stamping. The breadth reflects what the data shows. Print demand is diverse, not declining.
Sustainability
Sustainability and the print industry environmental shift

One of the most misunderstood printing industry statistics has to do with environmental impact. The print industry has made real progress on sustainability. According to Two Sides North America, the paper recovery rate in the United States tops 65 percent, which makes paper one of the most recycled materials on the planet.
Forests in North America have actually grown by more than 20 percent since 1970, according to the Food and Agriculture Organization of the United Nations. Responsible forestry and recycling programs mean print's environmental footprint is smaller than most people assume.
Compare that to the carbon cost of digital marketing, from data centers and server farms to device manufacturing and e-waste. The go-paperless-to-save-a-tree story does not hold up under scrutiny. Print, done responsibly, is a sustainable marketing channel.
By segment
Printing market size by segment
Not all print segments perform the same. The table below ranks the major categories, from the packaging print that leads global output to the publication print that keeps moving online.
| Segment | Where it stands |
|---|---|
| Packaging print | The largest and fastest-growing segment, driven by e-commerce and demand for sustainable packaging. |
| Commercial and marketing print | Stable, with growth in personalized and variable-data campaigns like the ones 4OVER4 prints daily. |
| Publication print | Declining as newspapers and magazines move online, though book printing stays healthy. |
| Functional and security print | Steady demand for labels, forms, checks, and identification documents. |
| Textile and industrial print | Growing fast with wide-format and specialty applications. |
The printing market size conversation keeps coming back to packaging, which holds the largest single share of global print output. Commercial print, the kind 4OVER4.COM specializes in, still represents a massive market that businesses rely on every day. Our full printing industry statistics hub covers each segment in detail.
Make it relevant
Personalization and variable data in print
Personalized print outperforms generic print by a wide margin. Variable data printing lets you customize each piece, from the name and offer to the image and the call to action, based on recipient data. The statistics show that personalization lifts response across every format and industry, and modern campaigns go far beyond a first name at the top of a letter.
Jobs and impact
Print industry employment and economic impact
The United States Bureau of Labor Statistics tracks employment in printing and related support activities. Total headcount has come down from its peak because of automation and consolidation, yet the industry still employs a large workforce, and skilled press operators stay in high demand.
The economic ripple runs well beyond the press floor. Paper mills, ink manufacturers, equipment suppliers, logistics companies, and design agencies all depend on the printing industry health. When businesses invest in print marketing, that spending cascades through many sectors of the economy.
Side by side
How print marketing compares to digital channels
Printing industry statistics get most useful when you set them beside other channels. Physical media wins on recall, trust, and response rate, while digital wins on speed and cost per impression. The comparison below puts print in context alongside email, paid social, and display advertising.
| Channel | Trust | Response and recall | Cost | Trackable |
|---|---|---|---|---|
| Direct mail | High, people hold it and keep it | 2.7% to 4.4% response on house lists | Higher per piece | Yes, with codes and QR |
| Lower, easy to ignore | Around 0.6% response, low recall | Very low per send | Yes | |
| Paid social | Lower, scrolled past | Low intent, short attention | Low cost per impression | Yes |
| Display ads | Lowest, banner blindness | Low click-through | Low cost per impression | Yes |
The smartest marketers do not choose one or the other. They run print and digital together, so a mailer triggers an online search and a business card drives a website visit. A postcard that sends someone to a landing page combines the strengths of both channels.
Specialty categories show how far this reaches. Our kids printing collection proves that niche print keeps finding enthusiastic audiences, from birthday invitations to classroom name tags that digital simply cannot replace.
The takeaway is straightforward. Print is not competing with digital. It completes it, and the data backs that up campaign after campaign.
Myths vs facts
Clearing up print misconceptions
A few myths keep marketers from running print that would pay off. The pairs below set each common assumption against what the printing industry statistics actually show, so you can plan on evidence rather than habit.
Print is dying and digital has replaced it.
Publication print has declined, but packaging, digital, and commercial print keep growing. The value per printed piece is higher than ever.
Email always beats print on results.
Email is cheaper per send, yet direct mail pulls 2.7 percent to 4.4 percent response against email at 0.6 percent, with far stronger recall.
Going paperless is automatically greener.
US paper recovery tops 65 percent and North American forests have grown over 20 percent since 1970, while digital carries its own data-center and e-waste footprint.
Print cannot be measured the way digital can.
Track response rate, cost per acquisition, and ROI, then add QR codes or unique offers per batch for hard, batch-level numbers.
Wally turns the print data into your next order
Statistics are step one. The printed piece is step two.
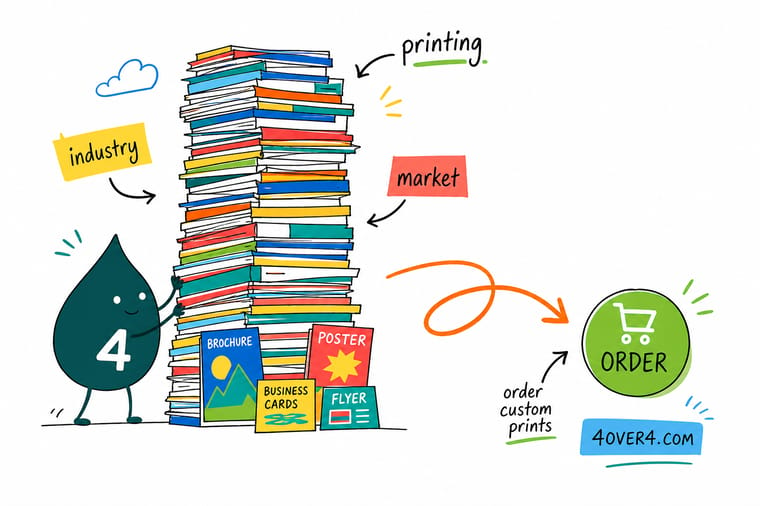
The numbers all point the same direction. A premium piece in someone's hands beats a message lost in a crowded inbox. Wally's rule is simple. Pick the product that fits your goal, print it on stock that signals quality, and let the response rate do the rest. Business cards are the fastest, highest-volume way to put this data to work.
Order business cards →The road ahead
What the data says about print future
Printing industry statistics point to a clear pattern. Total print volume may sit below its historical peak, but the value per printed piece is higher than ever. Personalization, premium finishes, and short-run economics have made each item more targeted and more effective.
The businesses that win treat print as a strategic channel, not an afterthought. They use data to target their mailings, invest in paper and finishes that make recipients stop, and track their results. 4OVER4.COM has processed more than 10,000 reviews at a 4.8 out of 5 average, evidence that businesses keep coming back to print because it delivers.
Our order data
What 4OVER4 order data reveals about print demand
Third-party research is valuable, but 25 plus years of running presses gives 4OVER4.COM a vantage point that market reports miss. Here is what we see across 150,000 plus business customers.
- 10 billion plus cards printed, with business cards the single most-ordered category year after year.
- 99 percent of customers say they will reorder, a retention rate that signals print is doing its job.
- 82 percent of orders ship early, because demand for fast turnaround keeps climbing and we keep meeting it.
- 1,000 plus products across dozens of categories, proof that print demand is diversifying, not fading.
These are not survey answers. They are operational facts from a company that processes printing orders every single day.
Where we fit
How 4OVER4 fits into the bigger printing picture
Printing industry statistics describe a market in transition, and 4OVER4.COM has been part of that shift since 1999. We keep adapting, investing in technology, and expanding product lines to match where demand is heading.
With 60 plus paper types, 1,000 plus products, and a 4.8 out of 5 rating across 10,000 plus reviews, we reflect the industry move toward quality, variety, and customer experience. That includes products you might not expect. Our custom invitations and our free business card program have put 8.8 million free cards into the hands of businesses and individuals, proof that lowering the barrier to entry grows the whole market.
I started with the free business cards and ended up ordering postcards, stickers, and banners within three months. The quality surprised me at every price point.
Verified customer, Freelance Designer
Start from a blank
Blank templates to get your artwork print-ready
Need a head start on design? These blank templates make it easy to get your files print-ready, with bleed and safe margins already built in.


Print it
The print products businesses reach for most
Knowing the statistics is step one. Executing a campaign that hits those benchmarks is step two, and it starts with the right piece. Here are the products businesses reach for most when they put these numbers to work.





Stock, finishing and price
What a business card run costs at 100 and up
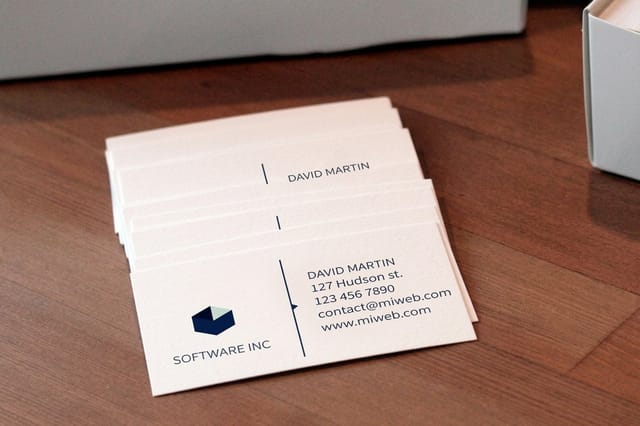
For businesses ready to act on these numbers, here is current pricing for business cards, the product that drives the whole category, alongside the full specifications so you can match the right stock and finish to your goals.
Why marketers trust us
The press behind this market data
Every benchmark on this page sits on a long record of getting print right. A 4.8 out of 5 average across 10,000 plus reviews, 150,000 plus businesses served, and print produced since 1999 are the trust signals behind the numbers, so you can plan an order knowing the pieces will land sharp and on time.
How we built this
The market reports and production data behind these figures
Every printing industry statistic on this page comes from published research, industry reporting, or 4OVER4.COM own order and review data. We reference organizations like Smithers, the Data and Marketing Association, Two Sides North America, and the United States Bureau of Labor Statistics, plus market projections from firms like Grand View Research and Mordor Intelligence.
Our internal data reflects 25 plus years of operation across 150,000 plus business accounts and 10,000 plus reviews. We refresh this page as new research becomes available, so the numbers stay accurate and useful for your planning.

Get Started
Ready to put these printing industry statistics to work?
Pick a product, drop in your design or a free template, and we will print it sharp on premium stock and ship it on time.
Legal Disclaimer
Gold Standard guarantees apply to all standard orders placed through 4over4.com. Price match requires verifiable proof of a competitor's published price for an equivalent product with matching specifications and turnaround time. Satisfaction guarantee covers manufacturing defects and print quality issues. Contact support with order number and documentation. On-time delivery rate based on tracked orders 1999 to 2026. Individual results may vary based on shipping carrier performance.
Explore more
Print market data, format statistics, and product pages
 Statistics Business Card Statistics Data on the most-ordered print product in the world.
  Statistics Packaging Industry Statistics The largest and fastest-growing print segment, by the numbers.
  Statistics Greeting Card Statistics Why consumers keep spending on cards they can hold.
  Statistics Print Advertising Statistics How print advertising holds up against digital channels. Hub Printing Industry Hub Every print statistics page gathered in one place.
  Product Business Cards Print the product that drives the whole category.
  Product Postcards The direct mail format with the highest response per dollar.
  Collection Kids Printing A niche print category that keeps finding its audience.
  Templates Blank Templates Print-ready files with bleed and safe margins built in. FAQs Printing FAQs Answers on stock, sizes, proofs, and turnaround.
 Questions and answers
Common questions about printing industry data
Market size, growth, response rates, sustainability, and products, answered.
How big is the global printing market in 2026?
The global printing market has been valued at more than 800 billion dollars according to Smithers, with packaging print driving the largest share of growth. Commercial printing, digital printing, and specialty segments like labels and signage all add to that total, and projections stay positive through 2030. Our printing industry statistics hub breaks each segment down further.
Is the printing industry growing or shrinking?
It depends on the segment. Publication printing has declined, but packaging print, digital printing, and commercial marketing materials are growing. Overall the market is transforming rather than disappearing, and the value per printed piece is higher than ever thanks to personalization and premium finishes.
What are the response rates for print marketing versus email?
Data and Marketing Association figures show direct mail earns 2.7 percent to 4.4 percent response on house lists, while email averages around 0.6 percent. That gap makes print a strong performer for acquisition and retention, especially when you pair it with a digital follow-up.
How does digital printing growth compare to offset?
Digital printing is growing at roughly 5 to 7 percent a year. Offset stays dominant for high-volume runs but grows more slowly. The shift toward shorter runs, variable data, and on-demand work favors digital, and most modern providers, 4OVER4.COM included, run both technologies.
Is print marketing environmentally sustainable?
More than most people assume. The United States paper recovery rate tops 65 percent and North American forests have grown over 20 percent since 1970. Factor in the energy, hardware, and e-waste behind digital marketing, and responsible print compares well. Order free samples to feel the recycled and sustainable stocks yourself.
What printed products are businesses ordering most?
Business cards remain the most-ordered single product, and 4OVER4.COM alone has printed 10 billion plus cards. Beyond that, postcards, flyers, stickers, packaging, and banners all see strong, growing demand. Browse our business cards or the full catalog to start your own order.
