
Promotional Products Statistics & Market Data for 2026


Market size, brand recall, cost per impression, and ROI, set against the order data behind 25 plus years of printing branded merchandise at 4OVER4.
Branded merchandise drives recall, loyalty, and impressions that digital cannot match. The U.S. promotional products industry tops 25 billion dollars a year, 83 percent of people recall the brand on an item they received, and the average product is kept for about eight months. With 150,000 plus businesses printing at 4OVER4.COM and 10 billion plus cards produced, the data backs up what marketers already feel.
The merchandise numbers
What the promotional products data tells us
Promotional products statistics paint a clear picture. Branded merchandise drives recall, builds loyalty, and outperforms many digital channels on cost per impression. The data below covers market size, consumer behavior, retention, and promotional items effectiveness across industries. 4OVER4.COM has printed for 150,000 plus businesses, and the trends explain why so many of them invest in tangible branded products. Start turning the numbers into a campaign with our Design Templates.
Why it matters
Why Promotional Products Statistics Matter for Your Next Campaign
Promotional products statistics are not just numbers on a page. They are the evidence behind real marketing decisions, the kind that decide whether your branded pens, tote bags, or custom stickers actually move the needle. Understanding promotional items effectiveness starts with what the data says about how people interact with physical branded goods.
The promotional products industry has grown steadily for more than a decade, and the numbers back up what marketers already feel. People keep, use, and remember tangible items far longer than digital ads. For a wider view of how print fits the bigger picture, see our Printing Industry Statistics. When you are ready to design something, the 4OVER4.COM Online Designer makes it simple to create across 1,000 plus products without a design degree.
Market size
Market Size and Industry Growth
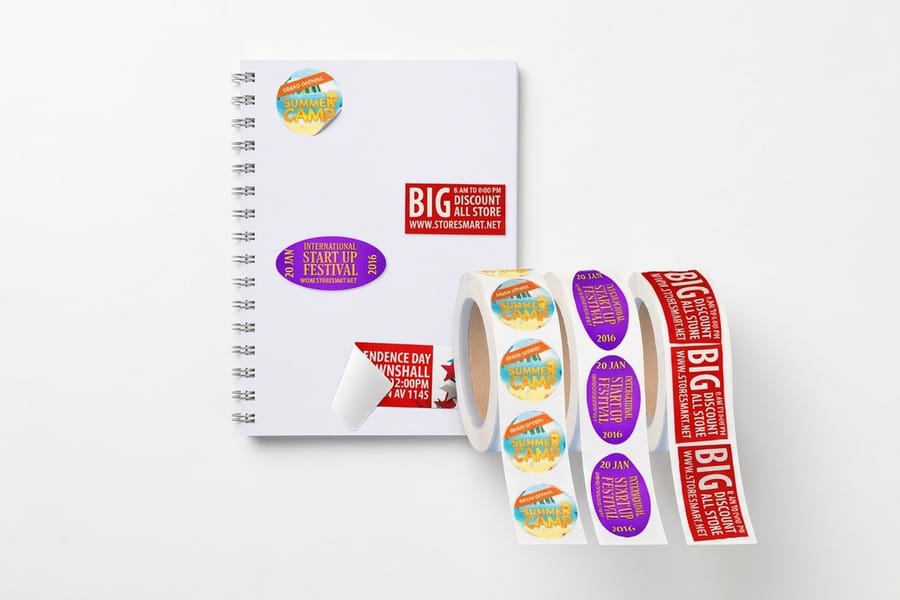
The promotional products market size tells a story of steady expansion. According to the Promotional Products Association International, the U.S. promotional products industry generates over 25 billion dollars in annual revenue. Globally the figure climbs higher as markets across Europe, Asia-Pacific, and Latin America keep adopting branded merchandise strategies.
What drives it? Companies are shifting budgets toward channels with measurable, long lasting impact, and a branded item on a desk delivers impressions for months. The cost of entry keeps dropping as printing technology improves, and 4OVER4.COM has been part of that shift for 25 plus years. Wearables lead category share, followed by writing instruments, drinkware, and bags, while printed items like the ones in our Business Card Statistics remain a backbone of the promotional mix.
Recall
Consumer Behavior and Brand Recall
Here is where the data gets interesting. According to PPAI research, 83 percent of consumers can recall the brand on a promotional product they received. Compare that to digital display ads, where recall sits in the single digits, and the gap is not small, it is a canyon.
People do not just remember promotional items, they keep them. The average consumer holds a promotional product for about eight months, and outerwear or umbrellas last far longer. Every day that item sits on a counter or gets worn in public it generates another impression at zero added cost. Nearly 80 percent of recipients look up the company after receiving a promotional item, a direct pipeline from physical product to website visit to conversion.
Cost per impression
Cost Per Impression Versus Digital Channels
One of the most compelling promotional products industry statistics is cost per impression. A promotional pen generates impressions at roughly a tenth of a cent each. A branded tote goes even lower, because people carry it to grocery stores, gyms, and offices, racking up hundreds of impressions a month. Digital display advertising runs 3 to 10 dollars per thousand impressions, so the math is not close.
The reason is simple. Promotional products keep working without ongoing spend. You pay once for the item and it delivers impressions for months, with no bidding war, no algorithm change, and no ad fatigue. Pair promotional items with strong print materials, like the campaigns in our Print Advertising Statistics, and the combined impact multiplies.
By product type
Promotional Items Effectiveness by Product Type
Not all promotional products perform equally, and the data shows clear winners. Writing instruments remain the most popular item, accounting for roughly 25 percent of all promotional product sales, because they are cheap, useful, and reached for daily.
Wearables generate the most impressions per item, an estimated 3,400 over their lifetime, so a branded shirt worn once a week outperforms most paid social campaigns. Bags and totes follow close behind at about 3,300 lifetime impressions, and drinkware lands near 1,400 with one of the highest retention rates. Printed items like stickers, business cards, and branded packaging round out the mix, and our Packaging Industry Statistics show how branded packaging alone can lift perceived product value by double digits.

By the numbers
Recall, retention, and cost per impression in four numbers
These are the headline figures marketers reach for first when they plan a giveaway, drawn from industry benchmarks and our own production data. A 25 billion dollar U.S. industry, 83 percent brand recall, and an eight month average retention window all point the same way. Set them against 25 plus years of printing branded merchandise at 4OVER4.COM and the picture stays consistent. The items people can hold get acted on.
Events and reach
Trade show and event statistics
Trade shows remain one of the biggest distribution channels for promotional products, and the numbers are hard to ignore. According to industry surveys, 81 percent of trade show attendees have buying authority, so the person picking up your branded stress ball or custom lanyard is usually the decision maker, not an intern and not a random passerby.
Exhibitors who hand out promotional products report 176 percent more foot traffic to their booths than those who do not, which nearly triples engagement. Follow up matters too. Recipients who got a promotional product are 52 percent more likely to visit the exhibitor again at the next event, so brand loyalty starts with that first physical touchpoint.
Product type and industry
How each product type and industry performs
Not all promotional products perform equally, and effectiveness shifts by industry, but the trend is steady across the board. When you put a physical item in someone's hands, they pay attention. Match the right product to the right audience and the numbers follow.
| Product type | What the data shows |
|---|---|
| Wearables | About 3,400 lifetime impressions, the highest of any item. |
| Bags and totes | Roughly 3,300 impressions, seen in public every single day. |
| Drinkware | Near 1,400 impressions with very high retention rates. |
| Writing instruments | The most distributed item at about 25 percent of all sales. |
| Stickers and labels | Low cost, high volume, and endlessly stickable branding. |
| Industry | How they use it |
|---|---|
| Trade shows | Giveaways pull 176 percent more booth traffic than none. |
| Real estate | Branded magnets and keychains keep agents top of mind. |
| Tech and SaaS | Custom notebooks and drinkware travel to every conference. |
| Nonprofit | Low cost items stretch a tight outreach budget further. |
| Retail | Branded bags turn every customer into a walking billboard. |
Your product choice should match your goal. Building booth traffic calls for a useful giveaway people keep. Rewarding loyal clients calls for premium drinkware or a branded notebook. Blanketing a neighborhood calls for low cost stickers or magnets. Each industry has its own benchmarks, but the common thread is relevance.
Side by side
How promotional products stack up against other channels
Promotional products statistics become most useful when you compare them against other channels. Marketers do not operate in a vacuum, and every dollar competes for the best return. The comparison below puts branded merchandise in context alongside email, paid social, and display advertising, the channels most likely to share your budget.
| Channel | Trust | Recall | Cost | Trackable |
|---|---|---|---|---|
| Promotional products | High, people keep and use them | 83 percent brand recall | Low per impression over time | Yes, with QR codes |
| Lower, easy to ignore | Low recall after the inbox | Very low per send | Yes | |
| Paid social | Lower, scrolled right past | Short attention, low recall | Low cost per impression | Yes |
| Display ads | Lowest, banner blindness | Single digit recall | Low cost per impression | Yes |
Physical products win on trust, recall, and staying power. Digital wins on speed and raw cost per send. The smartest marketers do not pick one, they use both. A branded item that carries a QR code to a landing page combines the strengths of each channel.
Businesses report that promotional products deliver a higher ROI than most other advertising, including television, radio, and online display. The mix of low cost per impression, high retention, and strong recall creates a compounding effect that is hard to beat. For a broader read on how physical media compares, our Print Industry Statistics tell the same story of retention and recall.
Small businesses especially benefit. A 500 dollar run of branded merchandise for a local event can generate thousands of impressions over the following year, while the same 500 dollars in digital ads might run out in a week.
Myths vs facts
What marketers get wrong about branded merchandise budgets
A few myths keep marketers from running promotions that would pay off. The pairs below set each common assumption against what the promotional products statistics actually show, so you can plan your next campaign on evidence rather than habit.
Digital ads always beat promotional products on recall.
Around 83 percent of people recall the brand on a promo item, while display ad recall sits in the single digits.
Promotional products are too expensive for small budgets.
A pen delivers impressions at about a tenth of a cent each, and one branded item keeps working for months with no added spend.
People throw promotional items away right away.
The average promotional product is kept for roughly eight months, and outerwear and drinkware last far longer.
Eco-friendly promo items are a nice-to-have, not a driver.
About 46 percent of consumers view a brand more favorably when the promotional product is eco-friendly.
Proof, not promises
What our merchandise runs show on price and turnaround
Third party promotional products statistics are valuable, but our own data adds another layer, drawn from 25 plus years of printing branded merchandise for businesses in every industry. With 10 billion plus cards printed and 10,000 plus reviews at a 4.8 out of 5 average, the patterns are clear. Businesses that invest in high quality printed promotional materials report stronger retention and higher perceived brand value.
Wally turns the data into your next giveaway
Statistics are only step one. The item is step two.
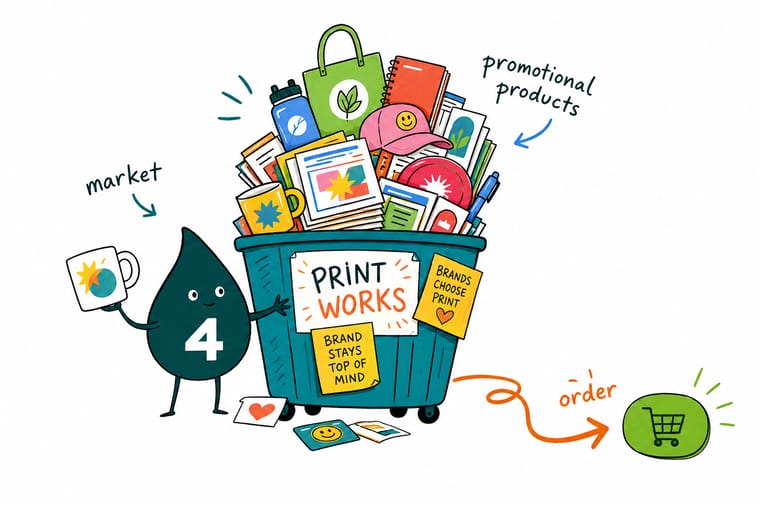
A branded item earns impressions for as long as it stays useful, which is what separates merchandise from an ad. Wally's rule is simple. Pick the product that fits your goal, print your logo heavy on stock that signals quality, and let recall do the rest. Cotton Totes start at one unit for $5.00 and ship in 1 business day. Standard Mugs start at $20.86 and take 5.
Order promotional stickers →Stock, finishing and price
Promotional sticker pricing and specifications
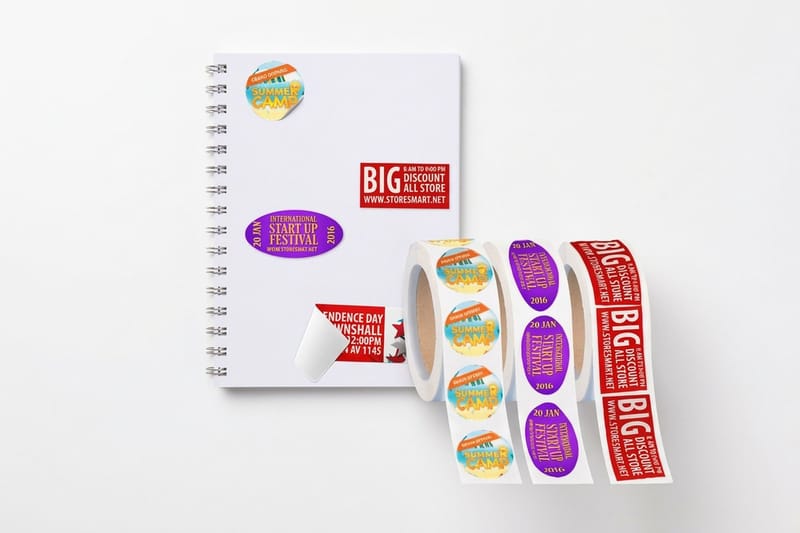
For businesses ready to act on these numbers, here is current pricing for Premium Promotional and Events Stickers, one of the most flexible branded items you can print, alongside the full specifications so you can match the right stock and finish to your campaign.
| Quantity | Price Per Unit | Total |
|---|---|---|
| 1 | $29.16 | $29.16 |
Start from a blank
Blank templates for promotional stickers
Need a head start on design? These blank templates for promotional and events stickers make it easy to get your artwork print ready, with bleed and safe margins already built in.
Print it
The promotional products marketers reach for most
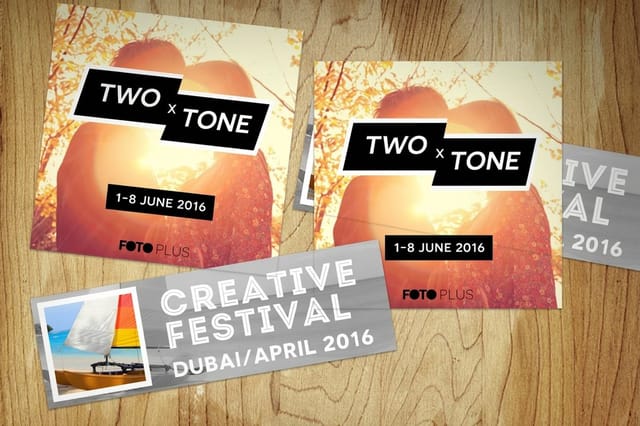
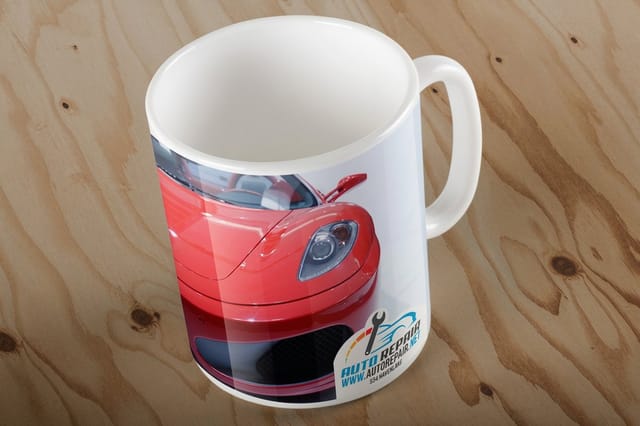
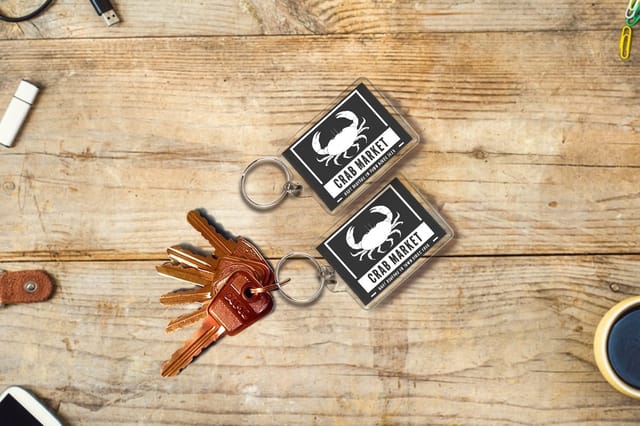
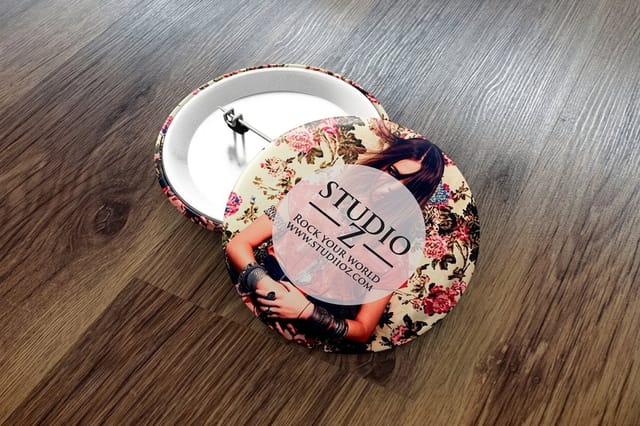
Cotton Totes start at one unit for $5.00 and ship in 1 business day. Standard Keychains run 25 for $53.55 and Standard Buttons 50 for $93.15, both in 5 business days. These are the items marketers order when they act on the recall numbers above.
What our print data reveals
What 4OVER4 order data says about promotional print
Promotional products statistics from third party sources are valuable, but 4OVER4.COM's own data, drawn from 150,000 plus businesses ordering print, adds insight those reports miss. With 10 billion plus cards printed, 10,000 plus reviews, and a 4.8 out of 5 star average, the trends are consistent.
Businesses that reorder promotional pieces tend to increase their quantities over time, a strong signal that campaigns are working. In fact, 99 percent of 4OVER4.COM customers reorder, which is not just satisfaction, it is proof that promotional items effectiveness translates into repeat investment. For a related print category with the same staying power, see our Greeting Card Industry Statistics.
We switched to 32pt ultra thick business cards from 4OVER4.COM for our trade show giveaways. People literally stopped to comment on the card quality. That is a promotional product doing its job.
Verified customer, Marketing Lead
Numbers to results
How 4OVER4 puts promotional products data into practice
Numbers are useful, but putting them to work is better. 4OVER4.COM has spent 25 plus years helping businesses turn promotional products statistics into real marketing results, not just data points on a slide deck. With 1,000 plus products and 60 plus paper types, you get the range to create branded materials that match the strategies on this page.
Our 99.8 percent on time delivery rate means your promotional products arrive when you need them, before the trade show, ahead of the launch, in time for the holiday campaign. And 82 percent of orders ship early, so you are often ahead of schedule. The promotional products industry statistics on this page are the foundation for every product we make.
I needed 2,000 branded postcards for a product launch in five days. 4OVER4.COM delivered in three. The print quality was sharp, the colors were vivid, and my team was blown away.
Verified customer, Brand Manager
Why marketers trust us
The production record behind these merchandise figures
Every benchmark on this page sits on a long record of getting print right. A 4.8 out of 5 average across 10,000 plus reviews, 150,000 plus businesses served, and branded merchandise printed since 1999 are the trust signals behind the numbers, so you can plan a promotion knowing the pieces will land sharp and on time.
How we built this
Where these promotional product figures come from
The promotional products statistics on this page come from industry association reports including PPAI and ASI, published market research, and 4OVER4.COM's internal order and customer data spanning 25 plus years. We cross reference multiple sources before including any figure and update numbers as new data becomes available. All 4OVER4.COM specific numbers, including our 150,000 plus business customer base and 10,000 plus reviews, are drawn directly from our verified records.

Get Started
Start with Cotton Totes at $5.00 each, shipped in 1 business day
Pick an item, drop in your design or a free template, and we will print it sharp on premium stock and ship it on time.
Legal Disclaimer
Gold Standard guarantees apply to all standard orders placed through 4over4.com. Price match requires verifiable proof of a competitor's published price for an equivalent product with matching specifications and turnaround time. Satisfaction guarantee covers manufacturing defects and print quality issues. Contact support with order number and documentation. On-time delivery rate based on tracked orders 1999 to 2026. Individual results may vary based on shipping carrier performance.
Explore more
Branded merchandise products, print statistics, and guides
Statistics Print Industry Statistics The parent hub for every print and merchandise data set we track.  Statistics Printing Industry Statistics Where promotional print sits inside the wider printing market.
  Statistics Business Card Statistics The most distributed printed promo item, by the numbers.
  Statistics Packaging Industry Statistics How branded packaging lifts perceived product value.
  Statistics Print Advertising Statistics Engagement and recall research behind print campaigns.
  Statistics Greeting Card Statistics Another print category where physical staying power shows.
 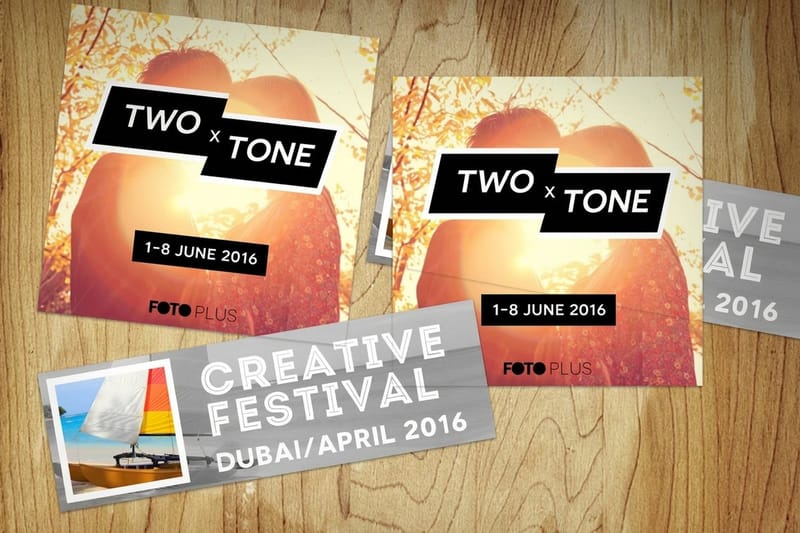 Product Promotional Stickers Print the branded stickers people actually stick and keep.
 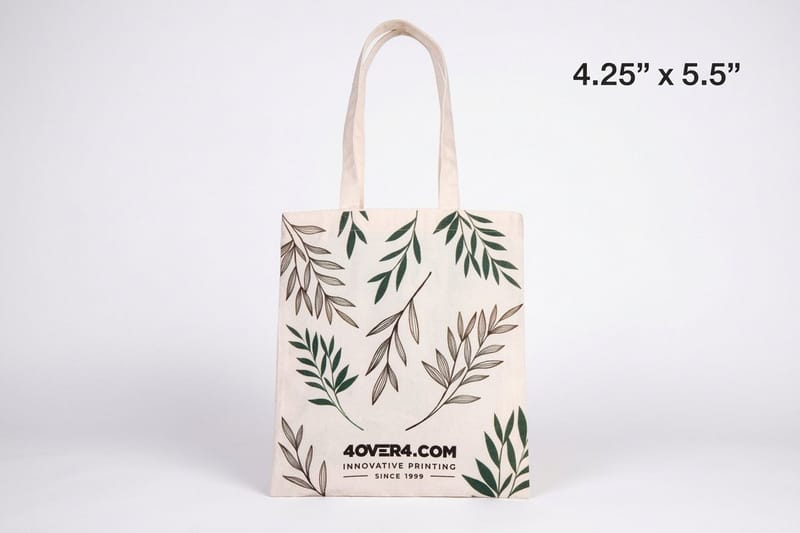 Product Cotton Tote Bags A walking billboard with thousands of lifetime impressions.
 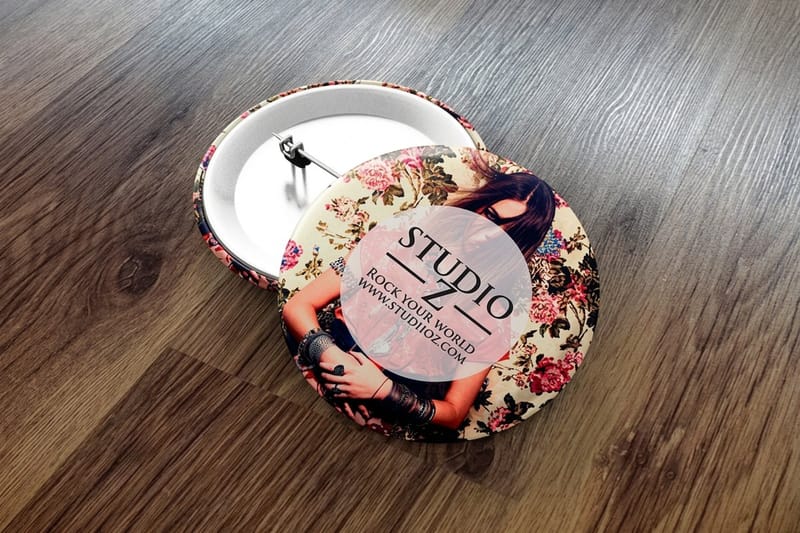 Shop Branded Merchandise Browse the full promotional and swag catalog in one place.
 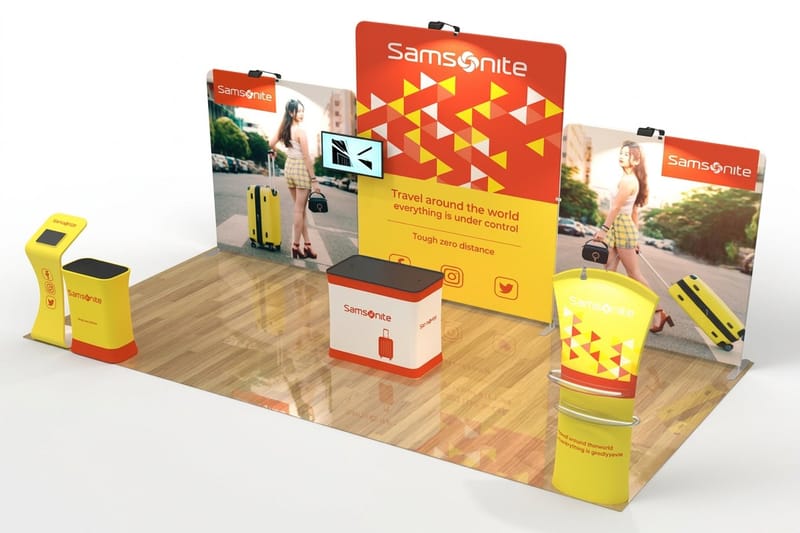 Shop Trade Shows and Events Everything you need for your next booth and giveaway.
 Questions and answers
Common questions about promotional products data and trends
Market size, impressions, cost, buying influence, product types, and sustainability, answered.
What is the current promotional products market size?
The U.S. promotional products market generates over 25 billion dollars in annual revenue, according to PPAI data. The global promotional products market size is larger still once you factor in growth across Europe and Asia-Pacific, which makes branded merchandise one of the biggest segments in the wider advertising industry.
Which promotional products generate the most impressions?
Wearables like branded shirts and hats generate roughly 3,400 impressions over their lifetime, making them the top performers. Bags and totes follow at about 3,300 impressions. Writing instruments are the most distributed item overall, at about 25 percent of all promotional product sales.
How do promotional products compare to digital advertising on cost?
Promotional products statistics consistently show a lower cost per impression than digital channels. A branded pen can deliver impressions at roughly a tenth of a cent each, while digital display ads typically cost 3 to 10 dollars per thousand impressions. The key difference is that promotional items keep generating impressions without ongoing ad spend.
Do promotional products actually influence buying decisions?
Yes. Promotional items effectiveness is well documented. Nearly 80 percent of recipients look up the company after receiving a branded item, and 83 percent can recall the brand on a promotional product they received. Pairing promotional items with a QR Code Generator link on the product makes tracking that conversion even easier.
What are the most popular types of promotional products?
Writing instruments lead the category, followed by wearables, drinkware, bags, and desk accessories. Printed promotional materials like business cards, stickers, and branded packaging also stay strong, especially when printed on premium stocks that people want to keep. Order Free Samples to feel the stock before you commit.
Are eco-friendly promotional products worth the investment?
The promotional products industry statistics say yes. About 46 percent of consumers view a brand more favorably when the promotional item is eco-friendly. Sustainable options like recycled materials and organic cotton are growing faster than conventional alternatives, which makes them both a values driven and a data driven choice.
