
Paper Waste Statistics Every Business Should Know in 2026


Recycling rates, office consumption, packaging waste, and production data, set against the order data behind 25 plus years of printing at 4OVER4.
Millions of tons of paper end up in landfills every year when they could be recycled, repurposed, or never printed at all. The U.S. recovers about 68 percent of its paper, corrugated cardboard tops 90 percent, and the average office worker burns 10,000 sheets a year. With 150,000 plus businesses printing at 4OVER4.COM and 10 billion plus cards produced, smart printing means less waste, not less impact.

The short version
What the latest paper waste statistics tell us
Paper waste statistics paint a clear picture. Every year millions of tons of paper end up in landfills when they could be recycled, repurposed, or never printed in the first place. The recycling story has genuinely improved, but a third of all paper still goes to waste, and offices remain a quiet hotspot. 4OVER4.COM has printed 10 billion plus cards for 150,000 plus businesses, and that experience taught us something simple. Smart printing means less waste, not less impact. Our daily deals show how ordering the right quantities at the right time cuts both cost and waste.
Why it still matters
Why paper waste data matters for every business that prints

Paper waste statistics are not just environmental talking points, they are business intelligence. Every sheet that gets tossed represents money spent, resources consumed, and opportunity lost. For the 150,000 plus businesses that trust 4OVER4.COM with their print orders, understanding these numbers helps make smarter calls about what to print, how much to order, and which materials to choose.
The connection between paper consumption and your bottom line is direct. Overprinting is the single biggest driver of waste in commercial print. For broader context on how the industry is shifting, our printing industry statistics break down the trends.
For a specific category that is evolving fast, our business card statistics show how digital first thinking is reshaping even the most traditional print product. The sections below walk through consumption, recycling, office waste, packaging, and production, one angle at a time.

By the numbers
Paper waste at a glance
Here are the headline figures that frame the whole conversation, drawn from published research and our own production data. Global output tops 400 million metric tons a year, U.S. recycling sits near 68 percent, and the average office worker runs through 10,000 sheets. Set those benchmarks against 25 plus years of printing at 4OVER4.COM and the pattern is consistent: the biggest wins come from printing less, not printing worse.
Consumption, recycling and production
Breaking down paper waste, recycling, and consumption data
Paper waste statistics cover a lot of ground, from office consumption to packaging waste to the recycling rates that decide whether discarded paper gets a second life. Here is the full breakdown so you can see where the real problems are and where the real progress is happening. 4OVER4.COM tracks waste across our own facilities, and the same patterns show up year after year.
Global paper consumption and where it ends up

Global paper and paperboard production tops 400 million metric tons a year, according to the Environmental Paper Network. Paper is one of the most recyclable materials on the planet, yet a large share still ends up in landfills or incinerators.
The United States alone accounts for roughly a quarter of global paper consumption. EPA data shows paper and paperboard make up the single largest component of municipal solid waste. That is not a footnote, it is the biggest category in the trash.
Packaging drives the most demand, followed by printing and writing papers. Office paper consumption statistics show the average worker uses about 10,000 sheets a year, and studies suggest nearly half of what offices print gets thrown away the same day.
Paper recycling statistics: progress and gaps

The good news is that recycling rates have climbed sharply over the past few decades. The American Forest and Paper Association puts the U.S. paper recycling rate near 68 percent, so roughly two of every three paper products get recovered rather than landfilled.
Recovery varies widely by grade. Corrugated cardboard recycles at above 90 percent in many regions, and newspapers recycle well too. Mixed office paper, coated stocks, and specialty print products recover at much lower rates.
There is a geographic divide as well. Urban areas with strong curbside programs beat rural communities, and contamination from food waste keeps effective rates down even where collection looks strong. Our packaging industry statistics break down the packaging waste side in detail.
Office paper waste: the hidden cost center

Office paper consumption statistics tell a story most businesses would rather not hear. Research from the EPA and workplace studies puts the average U.S. office at about 1.5 pounds of waste paper per employee per day. Over a year that adds up fast.
A big share of that printing is unnecessary. Internal documents read once and tossed, emails printed just in case, draft versions that never needed to be on paper at all. Studies suggest up to 45 percent of office pages hit the recycling bin or trash by end of day.
The financial hit is real. Factor in paper, ink or toner, printer maintenance, and energy, and the average office spends thousands of dollars a year on printing that produces waste. This is exactly why print on demand and right sized ordering matter.
Packaging waste statistics and the sustainability push

Packaging accounts for the largest share of paper use globally, and the numbers reflect both the scale of the problem and the push to solve it. Eurostat puts EU packaging waste above 80 million metric tons a year, with paper and cardboard the largest material category.
Consumer demand is driving real change. Research from McKinsey and other firms shows over 60 percent of consumers say they will pay more for products with sustainable packaging. That is reshaping supply chains, not just sentiment.
The shift has pushed paper based packaging forward as an alternative to plastic. Paper is renewable, recyclable, and biodegradable, but it is not automatically green. Sourcing, coatings, and transport all shape the footprint. Our print advertising statistics show how effective print stays even as sustainability pressure grows.
The environmental footprint of paper production
Paper production is resource intensive. The World Wildlife Fund ranks the pulp and paper industry as the fourth largest industrial consumer of energy worldwide. It takes large amounts of water, energy, and wood fiber to make paper products.
Deforestation remains a concern, though the picture is more complicated. Forest management in North America and Europe has improved, and the U.S. grows more trees than it harvests each year. In tropical regions, illegal logging and unsustainable forestry still drive habitat loss.
Water use and carbon add more weight to the equation. Mills are among the largest industrial water users, and the carbon footprint depends heavily on the energy source. Mills running on renewable energy or biomass emit far less than those burning fossil fuels.
Paper waste in the printing industry specifically
Commercial printing generates waste at several stages: setup waste known as makeready, overruns, misprints, trim waste, and obsolete inventory. Industry estimates put makeready waste alone at 5 to 15 percent of total paper on a job, depending on the press and setup.
Digital printing changed this equation. Unlike offset presses that need extensive setup and plates, digital presses produce short runs with minimal waste. A business ordering 250 postcards on a digital press creates a fraction of the waste a traditional offset run would.
4OVER4.COM runs a large digital and offset hybrid operation, so we match the production method to the order size. Short runs go digital, long runs go offset, and waste drops across the board. Our greeting card industry statistics show how print products keep adapting to these efficiency gains.
Category breakdown
How paper waste breaks down by category
Paper waste statistics get actionable when you compare categories side by side. Not all paper products are equal on volume, recycling potential, or environmental impact. Office paper consumption and packaging waste tell very different stories, and knowing the difference is the first step to focusing your effort where it counts.
| Category | How it recovers |
|---|---|
| Corrugated cardboard | Above 90 percent recovery, one of the highest rates of any material. |
| Newspaper and magazines | Strong recovery through established curbside programs. |
| Mixed office paper | Lower recovery, coatings and contamination drag it down. |
| Coated and specialty stock | Lowest recovery, laminations complicate recycling. |
| Source | What drives it |
|---|---|
| Makeready and setup | Runs 5 to 15 percent of paper used on offset jobs. |
| Overruns | Extra pieces printed beyond what actually gets distributed. |
| Obsolete inventory | Bulk runs that go stale the moment details change. |
| Trim and misprints | Edge trim and quality rejects at the finishing stage. |
Packaging carries higher total volume but also higher recycling rates. Office and commercial print paper has lower volume but often lower recovery, thanks to coatings, mixed materials, and contamination. For the wider view, our print industry statistics tie production volumes and waste trends together.
Side by side
How each paper category compares
Paper waste statistics become most useful when you line up the major categories against each other. The comparison below puts total volume, recycling rate, and the main challenge for each type of paper in one place, so you can see where the biggest opportunities for waste reduction actually sit.
| Category | Volume | Recycling rate | Main challenge |
|---|---|---|---|
| Packaging and cardboard | Largest share of paper use | High, above 90 percent for corrugated | Contamination from food waste |
| Printing and writing paper | Second largest category | Moderate, varies by stock | Coatings and mixed materials |
| Office paper | About 1.5 lbs per employee daily | Lower, mixed and coated stock | Same day disposal of prints |
| Newsprint | Declining volume | Strong recovery | Falling collection as print shrinks |
Packaging wins on total volume and, for corrugated cardboard, on recycling rate. Office paper is the harder problem because so much of it gets printed and discarded the same day. Newsprint recovers well but keeps shrinking as print circulation falls.
The common thread is that recovery drops the moment paper gets coated, laminated, or mixed with food waste. Choosing cleaner stocks and right sizing every run are the two levers that move all of these numbers in the right direction.
Make it count
What is changing in paper waste reduction
Several trends are pushing paper waste statistics in the right direction. Digital transformation genuinely reduced unnecessary printing, and offices that moved to digital workflows saw permanent drops in paper use that never fully reversed.
Print on demand keeps maturing, so businesses can print exactly what they need when they need it instead of warehousing thousands of pieces that go stale. That alone removes one of the biggest sources of marketing waste, obsolete inventory.
Recycling infrastructure is expanding too. New sorting technology, including AI powered optical sorting, means more recovered paper actually becomes new product rather than getting downgraded or landfilled from contamination. Paper based packaging is also gaining share from plastic, and FSC certified and recycled content stocks are moving from niche to mainstream.
Wally turns the data into less waste
Statistics are step one. Printing smarter is step two.
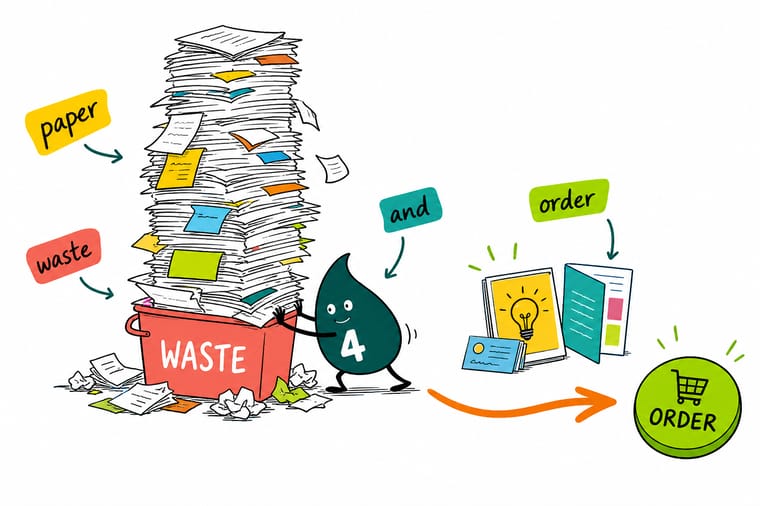
The numbers all point the same way. Most print waste comes from overprinting and obsolete stock, not from printing itself. Wally's rule is simple. Order the quantity your plan calls for, print short runs on digital, and choose recyclable stock without heavy coatings. With a third of all paper still heading to landfills and near half of office prints thrown away the day they are made, ordering the postcard quantity your plan calls for does more for your waste number than any recycling bin.
Print low waste postcards →Proof, not promises
Paper waste by the numbers at 4OVER4
Here is what waste reduction looks like from our side of the press. A 99.8 percent on-time delivery rate keeps schedules tight and obsolete stock rare, 60 plus paper types include recycled and FSC options, and 25 plus years of production data let us match the right method to the right run. These are the signals that turn the statistics above into a practical printing plan.
Stock, finishing and price
Postcard pricing and specifications
For businesses ready to act on these numbers, here is current pricing for postcards, a low waste format you can print on demand in the exact quantity you need, alongside the full specifications so you can match the right stock and finish to your goals.
| Quantity | Price Per Unit | Total |
|---|---|---|
| 50 | 33.0¢ | $16.48 |
| 100 | 24.2¢ | $24.16 |
| 200 | 15.9¢ | $31.86 |
| 300 | 12.8¢ | $38.45 |
| 400 | 11.3¢ | $45.04 |
| 500 | 10.3¢ | $51.62 |
| 600 | 9.89¢ | $59.31 |
| 700 | 9.57¢ | $67.00 |

Myths vs facts
Clearing up paper and recycling misconceptions
A few myths keep businesses from printing in a way that would save both paper and money. The pairs below set each common assumption against what the paper waste statistics actually show, so you can plan on evidence rather than habit.
Paper is bad for the planet, so going fully paperless is always greener.
Paper is renewable, recyclable, and biodegradable. Responsibly sourced and recycled paper often beats the energy and electronic waste footprint of the digital alternative.
Most paper just ends up in a landfill.
The U.S. recovers about 68 percent of its paper. Corrugated cardboard recycles at above 90 percent, one of the best rates of any material anywhere.
Printing more always means wasting more.
Right sized digital runs cut waste to a fraction of bulk offset. Printing what you will actually use beats overprinting to chase a lower unit price.
Recycled paper means lower print quality.
Modern recycled and FSC certified stocks print sharp and feel premium. You can choose responsibly without giving up color, finish, or durability.
Print it right
Low waste products to print on demand
Knowing the paper waste statistics is step one. Printing in a way that actually cuts waste is step two, and it starts with the right piece in the right quantity. Here are the products businesses reach for most when they put this data to work.






What our print data reveals
What 4OVER4 production data says about waste

Third party paper waste statistics are valuable, but our own data, drawn from 150,000 plus businesses ordering print over 25 plus years, adds another layer. Our internal tracking shows digital print jobs generate far less makeready waste than traditional offset runs, and for short run orders, waste per unit is a fraction of what it was a decade ago.
We have also seen a clear shift in ordering behavior. Businesses place smaller, more frequent orders rather than large bulk runs, which cuts obsolete inventory, one of the biggest hidden sources of print waste. When your brochure gets a new phone number, you no longer have 2,000 outdated copies sitting in a storage closet.
Office paper consumption statistics from our corporate clients confirm the same trend. Print volumes per employee are declining, but the prints that do happen are more targeted and far more likely to actually get used.
How we help
How 4OVER4 helps businesses print smarter and waste less
Paper waste statistics are a roadmap for how we run our business. With 1,000 plus products across 60 plus paper types, we give businesses the flexibility to order exactly what they need without overcommitting to massive print runs that end up in the recycling bin.
Our same day printing means you do not have to order weeks in advance and guess at quantities. Need 100 flyers for Friday, order them Thursday. That convenience also eliminates the waste that comes from over ordering just in case.
Digital printing paired with efficient workflows keeps makeready waste low, and because same day runs move on tight schedules, there is a built in incentive to minimize waste at every stage. Less waste means faster turnaround. It is good business and good environmental practice at the same time.
Why businesses trust us
Backed by 25 plus years of printing
Every benchmark on this page sits on a long record of getting print done right. A 4.8 out of 5 average across 10,000 plus reviews, 150,000 plus businesses served, and commercial printing since 1999 are the trust signals behind the numbers, so you can plan a run knowing the pieces will land sharp, on time, and on the stock you chose.
How we built this
Where this paper waste data comes from
The paper waste statistics on this page draw from publicly available data published by the U.S. Environmental Protection Agency, the American Forest and Paper Association, the Environmental Paper Network, Eurostat, and the World Wildlife Fund. 4OVER4.COM's internal production data comes from our own operational tracking across 25 plus years of commercial printing. All figures represent the most recently available data at time of publication, and we cross reference multiple sources before including any data point.

Get Started
Ready to put these paper waste statistics to work?
Pick a low waste format, drop in your design or a free template, and we will print it sharp on the stock you choose and ship it on time.
Legal Disclaimer
Gold Standard guarantees apply to all standard orders placed through 4over4.com. Price match requires verifiable proof of a competitor's published price for an equivalent product with matching specifications and turnaround time. Satisfaction guarantee covers manufacturing defects and print quality issues. Contact support with order number and documentation. On-time delivery rate based on tracked orders 1999 to 2026. Individual results may vary based on shipping carrier performance.
Explore more
Keep going across the print statistics silo
Statistics hub Print Industry Statistics The parent hub tying production, waste, and recycling data together.  Statistics Printing Industry Statistics Market size, growth, and where commercial print is heading.
  Statistics Business Card Statistics How digital first thinking is reshaping the most traditional print product.
  Statistics Packaging Industry Statistics Packaging waste, recycling rates, and the sustainable materials shift.
  Statistics Print Advertising Statistics Why print marketing stays effective even under sustainability pressure.
  Statistics Greeting Card Statistics How greeting cards adapt to short run efficiency and lower waste.
  Product Postcards A low waste format you can print on demand in the exact quantity you need.
  Benefit Same Day Printing Order what you need for Friday on Thursday, and skip the just in case overprint.
  Deals Daily Deals Order the right quantities at the right time to cut both cost and waste.
  Samples Free Paper Samples Feel recycled and FSC stocks before you commit to a full print run.
 Questions and answers
Common questions about paper waste and recycling data
Office waste, recycling rates, paper versus plastic, digital versus offset, and how to cut waste, answered.
How much paper waste does the average office produce each year?
Office paper consumption statistics point to around 10,000 sheets of paper per worker annually, and studies suggest nearly half of printed pages get discarded the same day. That works out to roughly 1.5 pounds of waste paper per employee per day, which adds up to real cost and environmental impact over a full year.
What percentage of paper actually gets recycled in the United States?
Paper recycling statistics from the American Forest and Paper Association put U.S. recycling near 68 percent. Corrugated cardboard leads at above 90 percent, while mixed office paper and coated print materials recover at lower rates. Contamination and limited curbside access in rural areas keep the national average below 70 percent.
How do paper waste statistics compare to plastic waste?
Paper makes up a larger share of municipal solid waste by weight than plastic, but paper recycles at dramatically higher rates. According to the EPA, paper recycling rates run about three times higher than plastic. Paper also biodegrades naturally, while most plastics persist for hundreds of years, which is a big reason packaging keeps shifting from plastic to paper.
Does digital printing produce less waste than offset printing?
Yes. Digital printing skips the plate making and extensive setup that offset presses require. Makeready waste on offset jobs can run 5 to 15 percent of total paper used, while digital presses start producing final prints almost immediately. 4OVER4.COM uses both digital and offset, matching the method to the job size so each run wastes as little as possible.
What is the biggest source of paper waste in commercial printing?
Obsolete inventory is the biggest hidden source. Businesses that order large quantities for a lower unit price often discard thousands of pieces when a phone number, address, or price changes. Ordering smaller quantities more often, even at a slightly higher unit cost, typically lowers both total waste and total spending. Grab free samples first to lock the stock before you commit to a run.
How can businesses reduce their paper waste from print marketing?
Three moves make the biggest difference. First, order right sized quantities based on actual distribution plans rather than just in case guesses. Second, use digital printing for short runs and variable data projects. Third, choose recyclable stocks without heavy coatings or laminations. Start with a low waste product like postcards and print only what you will hand out.
