
Nonprofit Marketing Statistics for 2026


Fundraising response rates, donor behavior, and channel benchmarks, set against the order data behind 25 plus years of printing nonprofit mail at 4OVER4.
Nonprofit marketing works best when the ask is something a donor can hold. Direct mail pulls a 5 to 9 percent response, email opens beat most industries, and a printed thank-you within 48 hours lifts repeat gifts. With 150,000 plus businesses printing with 4OVER4.COM and 10 billion plus cards produced, the data backs what fundraisers already feel.
The headline
What an appeal returns per dollar mailed
Nonprofit marketing statistics paint a clear picture. Donors respond to what they can hold, direct mail outperforms digital-only asks, and the organizations that thank and steward their donors keep more of them. With 150,000 plus businesses trusting 4OVER4.COM for print, the numbers back what fundraisers see on the ground, and free samples are ready whenever you want to feel the stock before your next campaign.

By the numbers
Four donor figures a campaign plan starts from
Here are the headline figures fundraisers reach for first when they plan a campaign, drawn from industry benchmarks and our own production data. Set them against 25 plus years of printing nonprofit mail at 4OVER4.COM and the pattern holds: the pieces people can hold get acted on.
Start here
Why these fundraising numbers matter
Nonprofit marketing statistics are more than figures on a slide. They are a roadmap for where your outreach dollars actually move the needle. Every dollar a nonprofit spends has to justify itself to the board, to donors, and to the communities you serve, and that pressure makes data-driven planning non-negotiable.
This page pulls together the fundraising trends, donor behavior, and channel benchmarks that shape smart campaigns in 2026. If you want to see how another sector weighs its marketing spend, our wedding industry statistics make a useful comparison. 4OVER4.COM has served more than 150,000 businesses, including thousands of nonprofits that lean on printed collateral to build trust, and our daily deals keep appeal mailers within budget. Grab a set of free samples to feel the stock before you commit.
The strongest channel
Direct mail still delivers for nonprofits
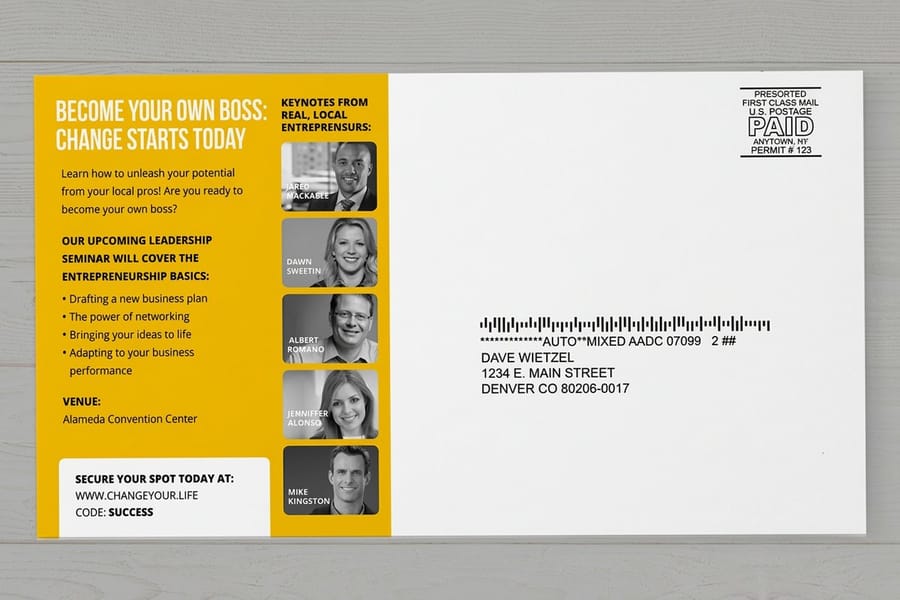
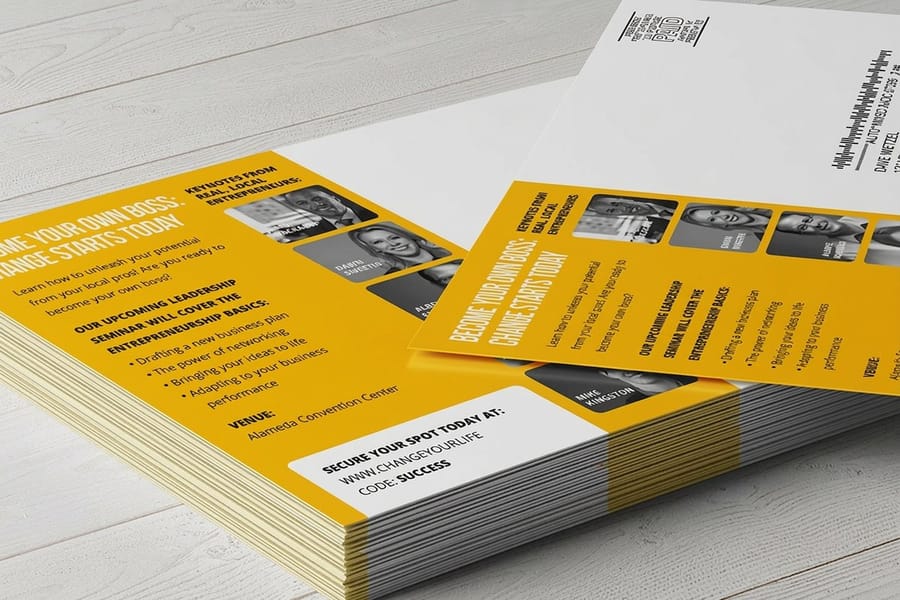
Direct mail remains one of the most effective channels for nonprofit fundraising. The Association of Fundraising Professionals puts the response rate for nonprofit mail campaigns between 5 and 9 percent, well above what digital channels reach on their own. That is not nostalgia. It is math.
Donors trust physical mail. A printed appeal letter, a well-designed postcard, or a branded envelope creates a tangible connection that email cannot replicate. For organizations running capital campaigns or year-end giving pushes, printed pieces remain the backbone of donor acquisition.
The key is quality. A flimsy postcard on thin stock gets tossed, while a thick, textured mailer with vivid color and a clear ask gets read. 4OVER4.COM prints on more than 60 paper types, so your materials can match the credibility of your mission. The same pattern shows up in our real estate marketing statistics, where print drives trust in high-stakes decisions.
Inbox performance
Email benchmarks for nonprofit campaigns
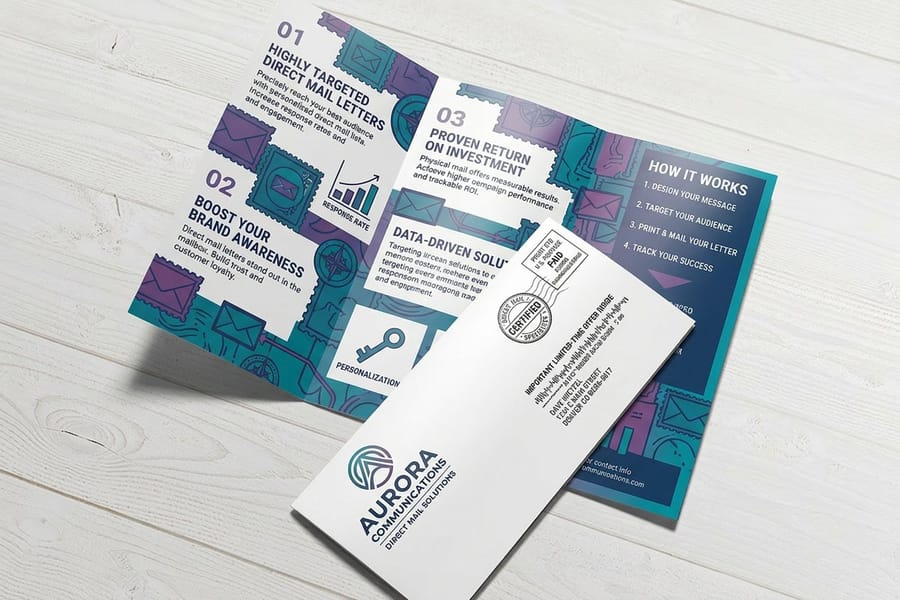
Nonprofit email campaigns see average open rates around 25 to 28 percent, according to Mailchimp's annual benchmark report. That is higher than most industries. Click-through rates sit near 2.7 percent, which means the real challenge is not earning opens. It is earning action.
Segmentation is what moves the number. Nonprofits that split their lists by donor history, giving level, or engagement frequency see far stronger results. A first-time donor needs a different message than a recurring monthly supporter.
Here is what the benchmarks rarely highlight. Email works best when it is paired with other channels. Organizations that combine email with direct mail convert at higher rates than those relying on a single touch. An email preview, a physical mailer, then a follow-up email creates several moments of engagement instead of one.
Top of funnel
Social media builds awareness, not gifts
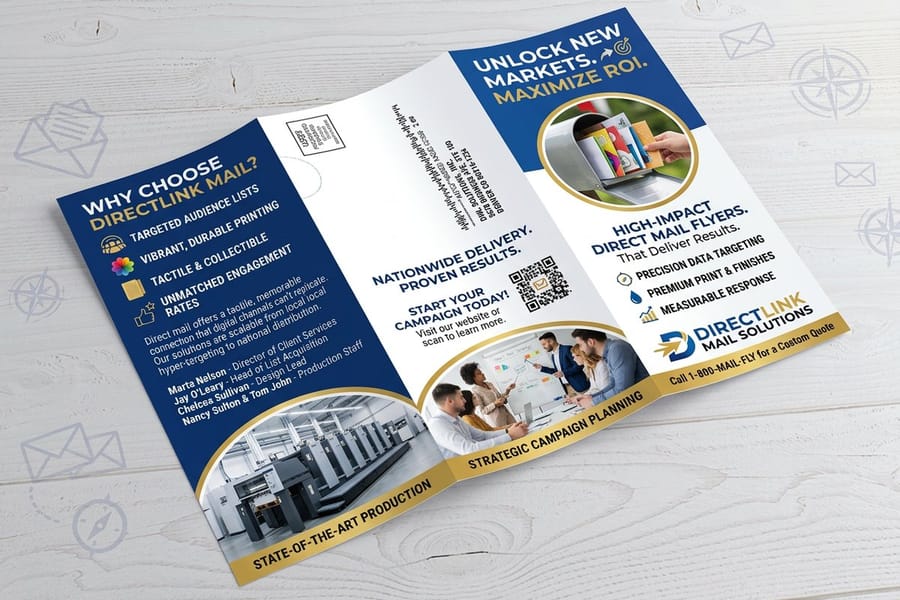
Social media is where nonprofits build awareness, but it is rarely where donations happen. Nonprofit Source reports that only about 1 to 2 percent of nonprofit website traffic from social media converts to a gift. That does not make social worthless. It makes its role different.
Social platforms excel at storytelling, volunteer recruitment, and event promotion. Facebook remains the dominant platform for nonprofit fundraising, and Facebook Fundraisers have generated billions in donations since launch. Instagram drives engagement for visual campaigns, while LinkedIn works for corporate partnerships and board recruitment.
The disconnect happens when a nonprofit treats social media as its primary fundraising channel. It is a top-of-funnel tool. The conversion happens through email, direct mail, or in-person events. Smart teams use social to drive traffic to a landing page, then follow up with printed thank-you cards and personal appeals.
For a look at how another service sector spreads spend across channels, our law firm marketing statistics show similar multi-channel patterns.
Community campaigns
School fundraising runs on local outreach
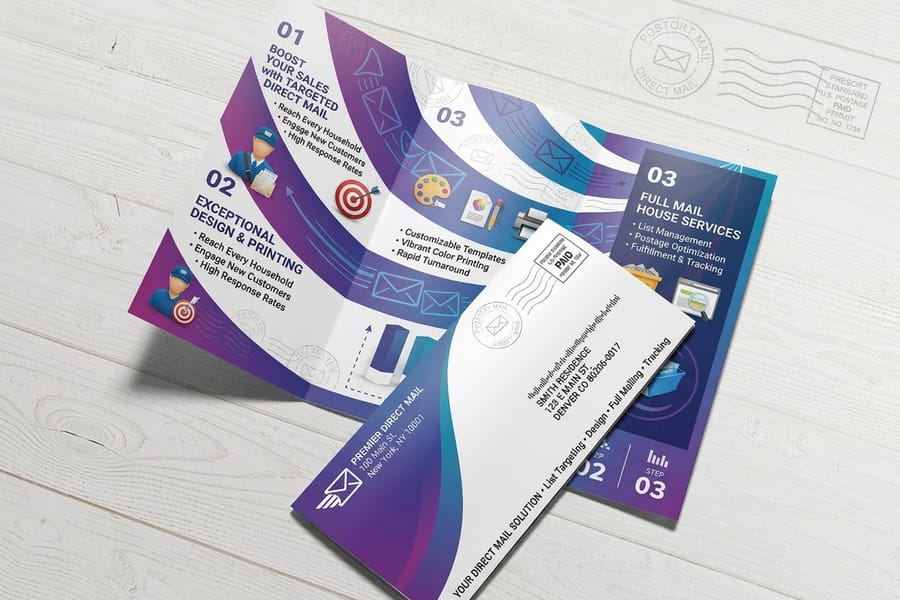
School fundraising statistics tell an interesting story about local engagement. PTA and PTO organizations raise an estimated 1.5 billion dollars each year in the United States, according to the National PTA. Most of that comes from in-person events, product sales, and direct community outreach rather than digital campaigns.
The most successful school fundraisers lean on printed materials. Flyers sent home in backpacks, event posters in hallways, and branded donation envelopes all drive participation. Parents respond to a physical reminder far more than an email blast that gets buried in a crowded inbox.
Budget by size
Charity benchmarks shift with organization size
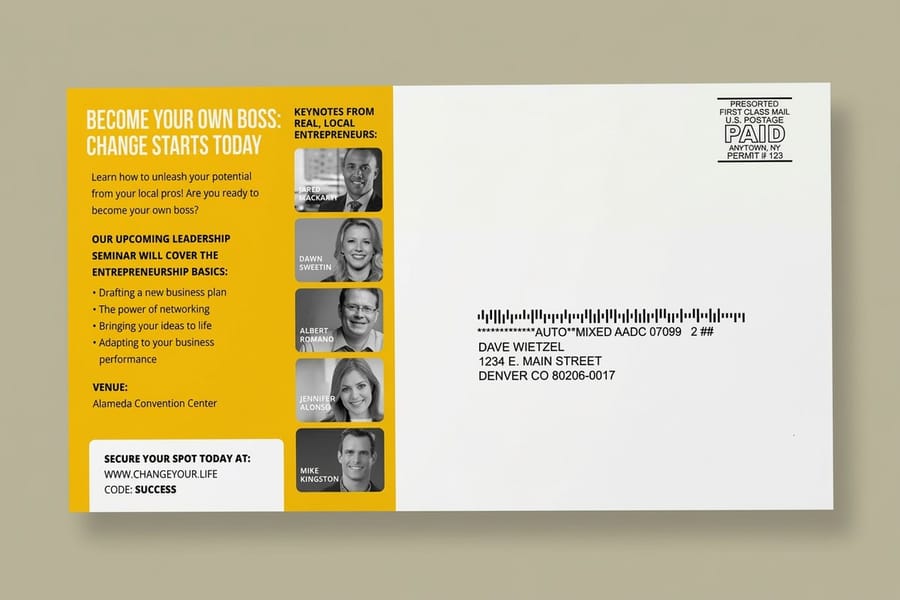
Charity fundraising statistics vary dramatically with size. Large nonprofits with budgets over 10 million dollars typically put 5 to 15 percent of their budget toward marketing and fundraising. Smaller organizations often spend a higher share, sometimes 20 to 25 percent, because they are still building a donor base.
The cost to raise a dollar shifts too. Established charities might spend 5 to 10 cents to bring in a dollar, while newer organizations can spend 25 to 50 cents or more. That is not inefficiency. It is the reality of building trust and awareness from scratch.
Print plays an outsized role for smaller nonprofits. A well-designed brochure or annual report signals a professionalism that a quick social post cannot match. When a potential major donor is deciding whether to write a five-figure check, the quality of your printed materials tells them you will steward the gift responsibly.
The pattern echoes our restaurant failure rate data, where businesses that invest in professional branding early tend to last longer.
Keep the donor
Donor retention is where budgets leak
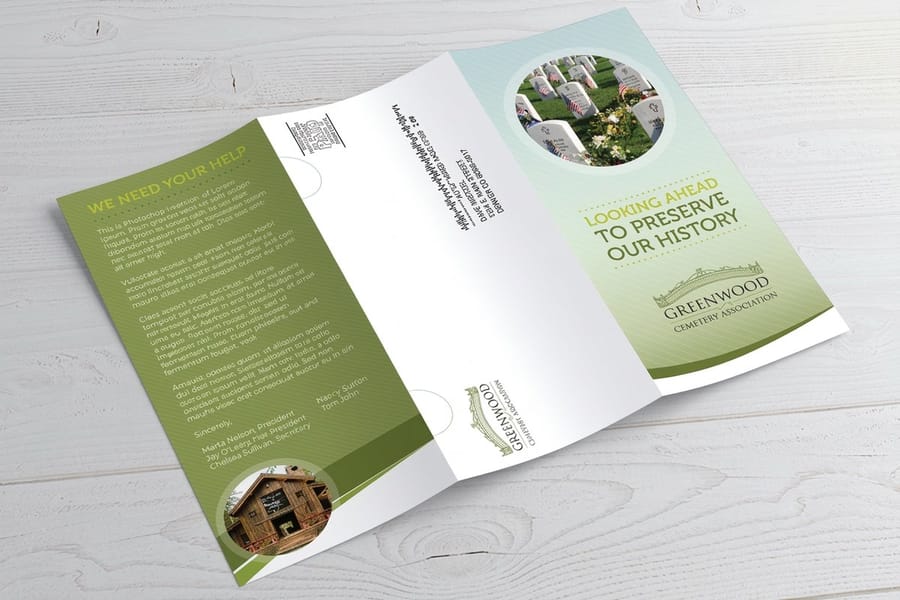
Donor retention is where nonprofit marketing statistics get uncomfortable. The average donor retention rate sits around 40 to 45 percent, according to the Fundraising Effectiveness Project. More than half of first-time donors never give a second time.
Acquiring a new donor costs 5 to 10 times more than keeping an existing one, yet many nonprofits pour their budget into acquisition and almost nothing into stewardship. A simple printed thank-you card mailed within 48 hours of a gift can raise the odds of a second donation by up to 40 percent.
The retention tactics that work are personal. Impact reports, handwritten notes or printed cards that feel handwritten, and updates reserved for recurring donors all reinforce the choice to give. The weight and texture of something that arrives in the mail makes the decision feel worthwhile.
We switched from digital-only appeals to a print and email combo last fall, and our year-end campaign raised 34 percent more than the year before. The postcards from 4OVER4.COM looked incredible, and donors actually mentioned them.
Rebecca L., Development Director
Return on spend
Print marketing ROI for nonprofits
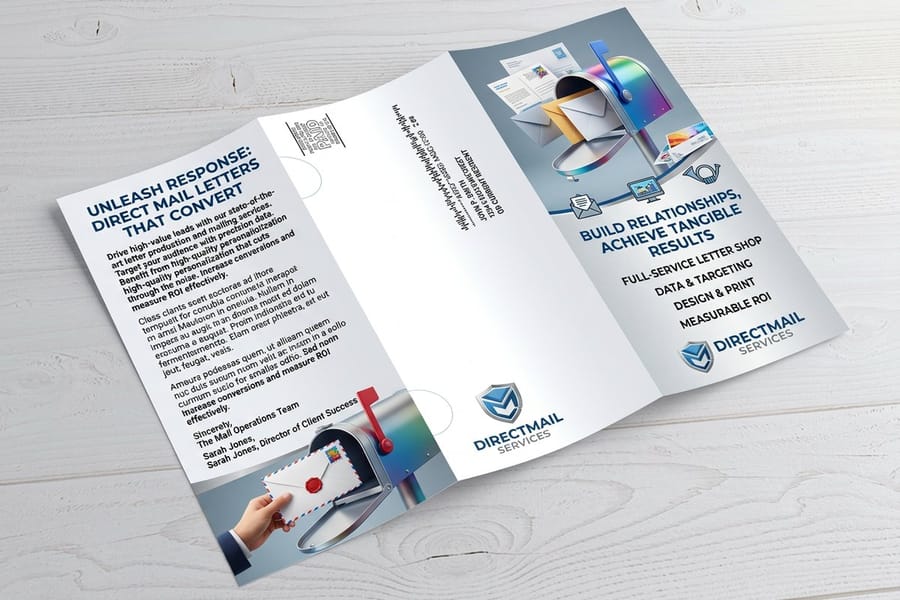
Print marketing delivers measurable return when nonprofits use it with intent. The Data and Marketing Association reports a median direct mail ROI of 29 percent across industries, and nonprofits often exceed that when they mail warm lists.
The metrics to track are cost per piece, response rate, average gift size, and lifetime donor value. A postcard campaign that costs 50 cents per piece in printing and postage and pulls a 7 percent response at a 75 dollar average gift delivers strong returns, especially when those donors stay for future campaigns.
4OVER4.COM helps control the cost-per-piece side of that equation. With more than 1,000 products and competitive pricing across quantity tiers, your team can run professional print campaigns without draining the budget. That is why more than 150,000 businesses trust 4OVER4.COM for print.
Our order data
What our nonprofit print orders reveal
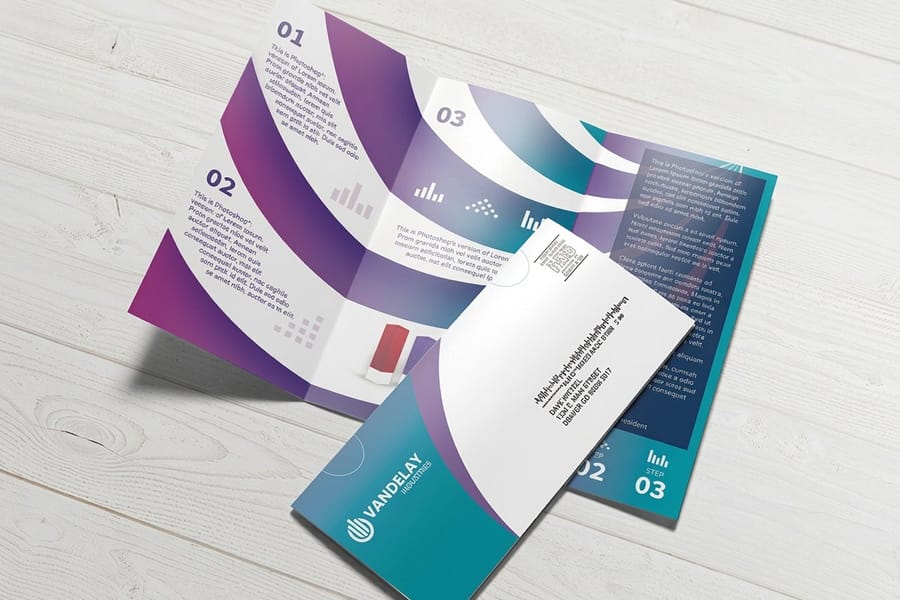
Industry reports tell part of the story. What 4OVER4.COM sees from real print orders adds another layer. Across more than 150,000 businesses, including nonprofits of every size, clear patterns emerge in how organizations use print to support their missions.
Nonprofit clients most often order postcards, brochures, event banners, and thank-you cards. Postcard orders spike in the fourth quarter alongside year-end giving, while brochure orders peak in spring as teams prepare for galas and annual events.
Organizations exploring the broader industry marketing statistics will find nonprofits follow seasonal rhythms much like retail, driven by fiscal deadlines and giving seasons rather than consumer holidays. School fundraising runs on a different clock, with peaks in September and March that track the academic calendar.
Built for nonprofits
How 4OVER4.COM supports your mission

Nonprofit marketing statistics make one point clear. Print quality shapes donor perception directly. A cheap-looking mailer undercuts your credibility, while a sturdy, vivid postcard on premium stock says you take the mission seriously.
4OVER4.COM has printed for nonprofits for more than 25 years, and that experience shows in color accuracy, paper selection, and on-time delivery. With more than 10,000 reviews and a 4.8 out of 5 star rating, the quality speaks for itself.
Your team gets the same 60 plus paper types and professional finishes that large brands use, at pricing built for organizations watching every dollar. Whether you print 250 event invitations or 10,000 appeal letters, the print quality builds the donor trust that the fundraising statistics show converts to gifts.
Side by side
Mailed appeals, email and events on the same scale
Nonprofit marketing statistics turn into strategy when you set the channels side by side. No single channel wins on every metric. Direct mail leads on response, email leads on cost, social leads on reach, and events lead on average gift size. The strongest programs combine them so each channel reinforces the next, a pattern our healthcare marketing statistics show holds across service sectors.
| Channel | Where it wins |
|---|---|
| Direct mail | Highest response rate, 5 to 9 percent, and the strongest donor trust. |
| Lowest cost per contact, best for stewardship and multi-touch follow-up. | |
| Social media | Widest reach for awareness, storytelling, and volunteer recruitment. |
| In-person events | Highest average gift size and face-to-face donor relationships. |
| Organization | What they spend |
|---|---|
| Large, over 10M budget | 5 to 15 percent of budget, roughly 5 to 10 cents to raise a dollar. |
| Growing mid-size | Rising marketing share as the donor base and brand mature. |
| Small or new | 20 to 25 percent of budget, 25 to 50 cents or more per dollar raised. |
| School PTA or PTO | Roughly 1.5 billion raised a year, mostly through local print and events. |
Your mix should match your goal. Driving awareness calls for social and email. Closing a major gift calls for a personal appeal in premium print. Stewarding a donor calls for a printed thank-you within 48 hours. Each nonprofit has its own rhythm, but the common thread is relevance and trust.
Make it relevant
Pair every appeal with a thank-you
Nonprofit marketing statistics point to one habit that pays off more than any single acquisition tactic: stewardship. The organizations that thank donors quickly and personally keep more of them, and retention compounds because a kept donor costs a fraction of a new one to reach.
Proof, not promises
What appeal mailings cost to print and when they ship
Here are the production and quality signals that round out the picture for fundraisers planning campaigns in 2026 and beyond. A 99.8 percent on-time delivery rate keeps your giving-season schedule on track, and a 4.8 out of 5 average across 10,000 plus reviews shows the print quality holds up piece after piece.
Stock, finishing and price
Appeal postcards: 500 mailed for $89.68, letters for $238.73
For teams ready to act on these numbers, here is current pricing for Postcards, the nonprofit appeal format with the highest response per dollar, alongside the full specifications so you can match the right stock and finish to your campaign.
| Quantity | Price Per Unit | Total |
|---|---|---|
| 50 | 33.0¢ | $16.48 |
| 100 | 24.2¢ | $24.16 |
| 200 | 15.9¢ | $31.86 |
| 300 | 12.8¢ | $38.45 |
| 400 | 11.3¢ | $45.04 |
| 500 | 10.3¢ | $51.62 |
| 600 | 9.89¢ | $59.31 |
| 700 | 9.57¢ | $67.00 |

Wally turns the data into your next appeal
Statistics are step one. The mailer is step two.
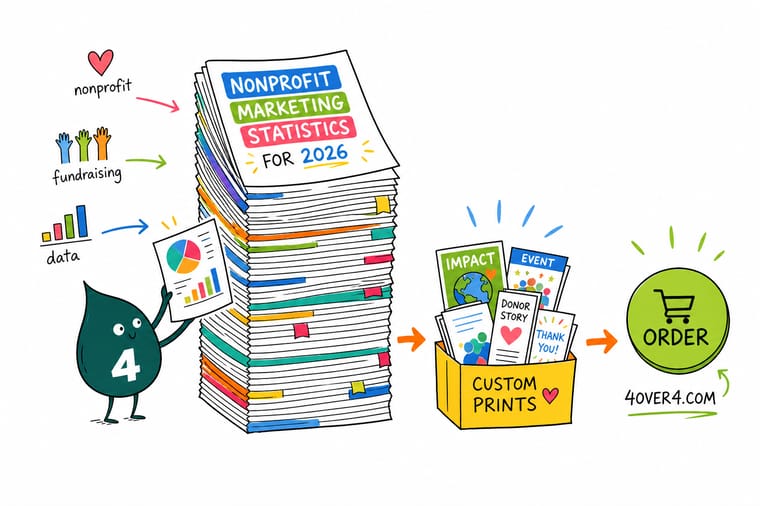
The numbers all point the same way. A premium piece in a donor's hands beats a message lost in an inbox. Wally's rule is simple. Lead with direct mail for the ask, thank every donor in print within 48 hours, and let retention do the compounding. At a 5 to 9 percent response, a postcard appeal reaches donors who never open the email, and the printed thank-you inside 48 hours is what turns a first gift into a second.
Order postcards →Start from a blank
Blank templates for nonprofit mailers
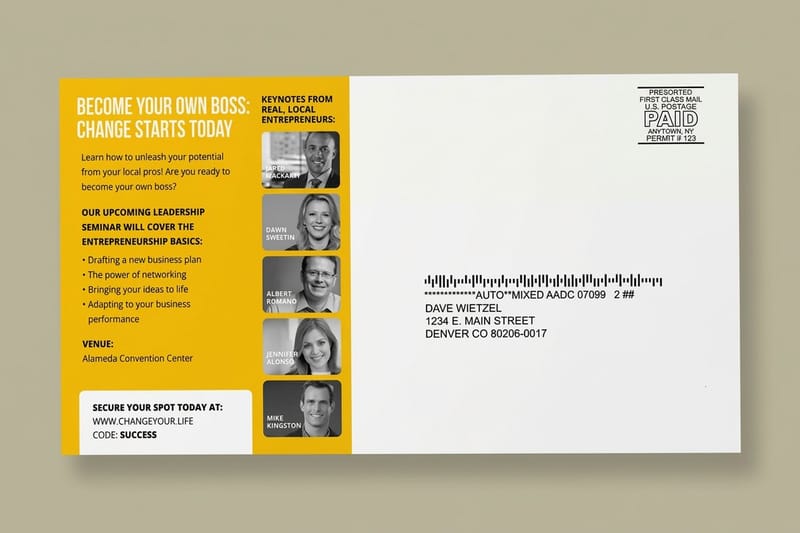
Need a head start on design? These blank templates make it easy to get your appeal artwork print-ready, with bleed and safe margins already built in.
One clear view
How nonprofit channels stack up head to head
Here is the same picture in one table, so you can weigh donor trust, response, cost, and fit before you set your channel mix. Fundraisers do not operate in a vacuum, and every dollar has to compete for the best return.
| Channel | Donor trust | Response and recall | Cost | Best for |
|---|---|---|---|---|
| Direct mail | High, donors keep it | 5 to 9 percent response, strong recall | Higher per piece | Appeals, thank-you cards, year-end |
| Moderate | 25 to 28 percent open, 2.7 percent click | Very low per send | Stewardship and follow-up | |
| Social media | Lower | 1 to 2 percent of traffic converts | Low per impression | Awareness and recruitment |
| In-person events | High, personal | Highest average gift size | Higher per attendee | Major donors and community |
Direct mail wins on trust, response rate, and memorability. Digital wins on speed and cost per contact. The smartest fundraisers do not pick one or the other, they use both. A postcard that drives a supporter to a giving page combines the strengths of both channels.
4OVER4.COM has printed over 10 billion cards and mailers, and the feedback is consistent. Quality print on premium stock gets better results than thin, flimsy alternatives, and for nonprofits the medium is part of the message.
Myths vs facts
What boards assume about mailing costs and donors
A few myths keep fundraisers from running outreach that would pay off. The pairs below set each common assumption against what the nonprofit marketing statistics actually show, so you can plan your next campaign on evidence rather than habit.
Social media is where nonprofit donations happen.
Only about 1 to 2 percent of social traffic converts to a gift. Social builds awareness, while email, mail, and events close the donation.
Direct mail is outdated for fundraising.
Appeal mail earns a 5 to 9 percent response rate, far above digital alone, because donors trust a piece they can hold.
Winning the first gift is the hard part.
More than half of first-time donors never give again, so a printed thank-you within 48 hours matters as much as the ask.
Small nonprofits cannot afford professional print.
A well-made brochure signals credibility a free social post cannot, and it often decides whether a major donor writes the check.
Print it
The print pieces nonprofits reach for most
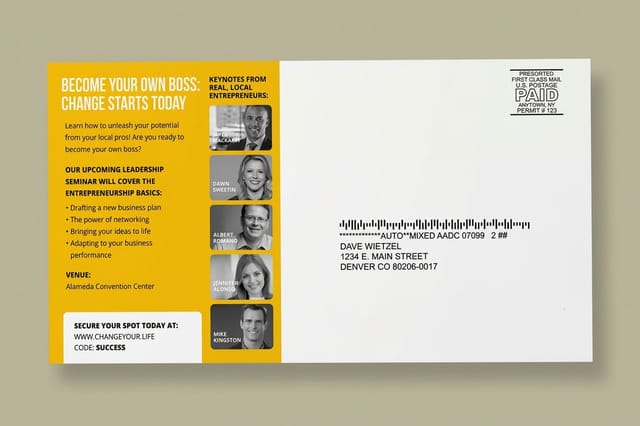
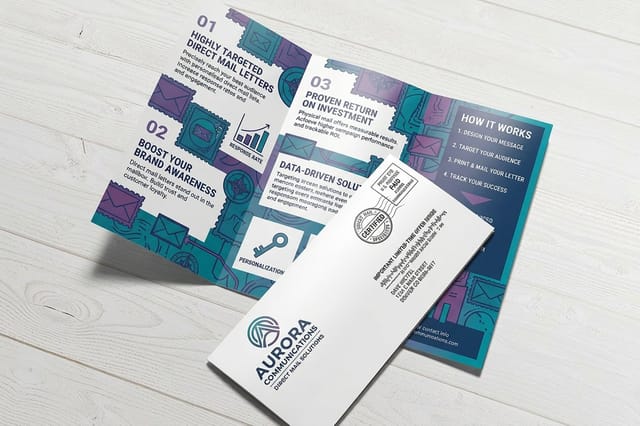
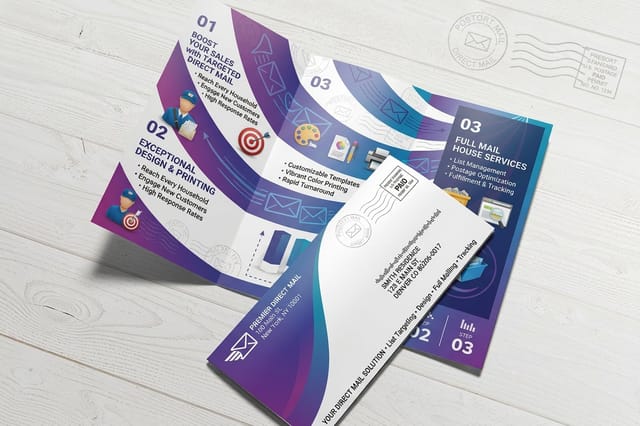
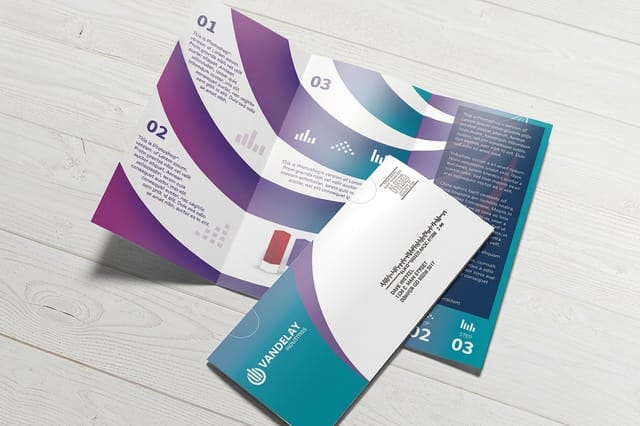
Knowing the fundraising statistics is step one. Executing a campaign that hits those benchmarks is step two, and it starts with the right piece. Here are the products nonprofits reach for most when they put these numbers to work.

Why fundraisers trust us
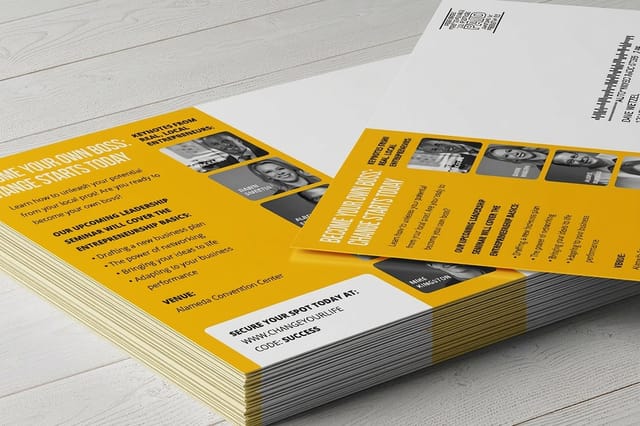
The press that runs these donor mailings
Every benchmark on this page sits on a long record of getting mail printed right. A 4.8 out of 5 average across 10,000 plus reviews, 150,000 plus businesses served, and nonprofit mail printed since 1999 are the trust signals behind the numbers, so you can plan an appeal knowing the pieces will land sharp and on time.
How we built this
Where each nonprofit figure on this page comes from
Every figure on this page comes from published research by the Association of Fundraising Professionals, the Fundraising Effectiveness Project, the Data and Marketing Association, Mailchimp, the National PTA, and Nonprofit Source, cross-referenced against 4OVER4.COM order data from more than 150,000 business clients. Figures reflect the most recent data available, and we refresh the page as new reports publish.

Get Started
Mail 500 appeal postcards for $89.68, printed in 4 business days
Pick a format, drop in your design or a free template, and we will print your appeal sharp on premium stock and ship it on time.
Legal Disclaimer
Gold Standard guarantees apply to all standard orders placed through 4over4.com. Price match requires verifiable proof of a competitor's published price for an equivalent product with matching specifications and turnaround time. Satisfaction guarantee covers manufacturing defects and print quality issues. Contact support with order number and documentation. On-time delivery rate based on tracked orders 1999 to 2026. Individual results may vary based on shipping carrier performance.
Explore more
Fundraising guides, mailing products and donor benchmarks
Statistics Industry Marketing Statistics The hub of sector-by-sector marketing benchmarks.  Statistics Real Estate Marketing Data How print drives trust in high-stakes decisions.
  Statistics Healthcare Marketing Data Channel performance for patient and donor outreach.
  Statistics Law Firm Marketing Data Multi-channel patterns for professional services.
  Product Postcards The highest response per dollar for appeals.
  Guide How to Make Postcards Design, print, and mail an appeal step by step.
  Samples Free Samples Feel the stock before your next donor mailer.
  Templates Postcard Templates Print-ready layouts with bleed and safe margins. Deals Daily Deals Keep appeal print runs inside the budget. FAQs Printing FAQs Answers on stock, sizes, proofs, and turnaround.
 Questions and answers
Common questions about nonprofit marketing data
Retention, budgets, direct mail, school fundraising, and channel ROI, answered.
What is the average donor retention rate for nonprofits?
The average donor retention rate hovers around 40 to 45 percent, according to the Fundraising Effectiveness Project, so most first-time donors do not give a second time. Personal follow-up, especially a printed thank-you card mailed within 48 hours, lifts retention noticeably. Grab free samples of thank-you card stock to see the quality before you order.
How much should a nonprofit spend on marketing?
Most nonprofits put 5 to 15 percent of their total budget toward marketing and fundraising, and smaller organizations often spend more as they build awareness. The data suggests print-heavy campaigns deliver stronger ROI on warm donor lists, while digital channels work better for broad awareness and volunteer recruitment.
Does direct mail still work for nonprofit fundraising?
Yes. Direct mail generates response rates between 5 and 9 percent for nonprofit campaigns, well above email or social media alone. Physical mail builds trust and drives higher average gifts, and the key is quality materials that reflect your professionalism.
What are the most effective school fundraising methods?
School fundraising leans on in-person events, product sales, and community outreach, and PTAs raise an estimated 1.5 billion dollars a year in the United States. Printed flyers, event posters, and branded materials sent home with students outperform digital-only asks. Adding a QR code bridges print and digital, so try our QR code generator for your next campaign.
How do charity fundraising benchmarks differ by organization size?
Larger charities with budgets over 10 million dollars typically spend 5 to 10 cents to raise a dollar, while smaller organizations may spend 25 to 50 cents. Building a donor base from scratch takes more upfront investment, and professional print helps smaller nonprofits signal credibility and punch above their weight.
Which marketing channel has the best ROI for nonprofits?
Direct mail leads with a median ROI of 29 percent, according to the Data and Marketing Association, and nonprofits often beat that benchmark. Email offers the lowest cost per contact. The strongest results come from a multi-channel mix that combines print, email, and social for both acquisition and retention.
