
Graphic Design Statistics Every Marketer Should Know


Industry size, visual content performance, print versus digital, and color psychology, set against the order data behind 25 plus years of printing at 4OVER4.
Graphic design is a measurable growth lever, not decoration. Content with relevant images earns 94 percent more views, brand consistency raises revenue by up to 23 percent, and color drives 90 percent of snap judgments. With 150,000 plus businesses printing with 4OVER4.COM and 10 billion plus cards produced, the data backs up what marketers already feel: design quality shows up in revenue.
The short version
What the numbers tell us about graphic design
Graphic design statistics paint a clear picture. Visual content drives business results, from social engagement to print conversions, and design quality shows up directly in revenue. 4OVER4.COM has printed 10 billion plus cards for 150,000 plus businesses, which gives us a front-row view of how design choices play out in the real world. The takeaways below cover industry growth, visual content performance, print ROI, and what is working for businesses right now.

By the numbers
Four design figures with revenue attached
Here are the headline figures marketers reach for first when they build a case for design, drawn from industry research and our own production data. The U.S. graphic design market clears 15 billion dollars a year, the brain registers an image in 13 milliseconds, and content with images earns 94 percent more views. Set those benchmarks against 25 plus years of printing at 4OVER4.COM and the picture is consistent: visual quality gets acted on.
Why it matters
Why graphic design statistics matter for your business

Graphic design statistics are not just numbers on a page. They are a roadmap for where to spend your marketing budget. Businesses that invest in professional visual content consistently outperform the ones that do not, and that is a pattern in the data rather than a matter of opinion.
The industry has grown steadily for a decade, and visual content marketing statistics show no sign of slowing down. Print and digital design work together to build recognition, and the companies watching the industry marketing statistics are the ones taking market share. The same trends hold across sectors, from hospitality to healthcare to wedding industry data and event planning.
4OVER4.COM has tracked design and print trends across 25 plus years in the business. Here is what the data actually says.
Industry size
Graphic design industry statistics that shape how businesses market

The global graphic design market is large and still expanding. The U.S. graphic design services industry generates over 15 billion dollars in annual revenue according to IBISWorld, and that figure has climbed as businesses treat professional design as a requirement rather than a luxury.
Visual content statistics confirm what most marketers already feel. People process images faster than text, and research from MIT found the brain can register an image in as little as 13 milliseconds. Your business card, your flyer, your social post all make an impression before anyone reads a single word.
The Bureau of Labor Statistics projects steady demand for designers through 2032, with strong growth in digital and multimedia work. Print has not disappeared either. Restaurants that invest in branded materials tend to survive longer, a pattern the restaurant failure rate data makes clear.
We redesigned all our print materials to match our updated brand, and the response was immediate. People noticed, and our referral rate went up within the first quarter.
Marcus T., Brand Owner
Visual content
Visual content marketing statistics you should know
Visual content marketing statistics tell a compelling story about design's role in growth. Content with relevant images earns 94 percent more views than content without according to MDG Advertising. That is not a marginal gain, it is close to double the attention.
Social algorithms favor visuals. Posts with images produce 650 percent higher engagement than text-only posts per Adobe data, and video and infographics push further still in the right context. Static design on printed materials, packaging, and signage still drives the most tangible outcomes.
Brand consistency across every visual touchpoint raises revenue by up to 23 percent according to Lucidpress. Your cards, postcards, brochures, and digital assets all need to look like they came from the same brand. Consistency is more than aesthetics, it is money.
Print versus digital
Print design versus digital design performance
Here is where the graphic design industry statistics get interesting. Print and digital are not competitors, they are teammates. The Data and Marketing Association reports direct mail achieves a 9 percent response rate for house lists against email's 1 percent average, and strong design pushes those numbers higher.
Color printing raises readership by 40 percent compared to black and white, and full-color designs are 39 percent more memorable than single-color alternatives. Agents who use professionally designed postcards and flyers generate more listings, a pattern the real estate marketing statistics show plainly.
4OVER4.COM offers 60 plus paper types and 1,000 plus products because design does not exist in a vacuum. Stock, finish, and weight are part of the design. A matte finish says something different than a gloss, and a 32pt card says something a 14pt card cannot.
Color and type
Color psychology and typography that make design work

Color accounts for up to 90 percent of the snap judgments people make about a product according to research in Management Decision. Blue builds trust, red creates urgency, and green signals health and sustainability. These associations are backed by decades of consumer psychology, not guesswork.
Typography choices affect comprehension by up to 20 percent according to the Software Usability Research Laboratory. Serif fonts read better in print, sans-serif works better on screens, and using more than three font families in one design lowers perceived professionalism.
Design quality correlates with business performance across every sector, from professional services to hospitality. Firms with professionally designed cards and stationery read as more credible, a pattern the law firm marketing statistics confirm, and well-designed menus lift per-table revenue by 10 to 15 percent.
Our print data
What 4OVER4 order data reveals about design choices
Third-party statistics are valuable, but 4OVER4.COM's own data, drawn from 150,000 plus businesses ordering print, adds another layer. After printing 10 billion plus cards over 25 plus years, with 10,000 plus reviews averaging 4.8 out of 5 stars, we see patterns that industry reports miss.
Premium stocks and specialty finishes grow in popularity year over year. Businesses choose thicker cards, textured papers, and finishes like spot UV and foil stamping at rising rates, which tracks with the research showing tactile elements improve brand perception.
Knowing the data is one thing, acting on it is another. Planning an event? Our premium invitations show how professional design and premium printing come together, and our custom projects handle anything outside the standard catalog on 60 plus paper types.
I am a solo real estate agent with no design team. Using 4OVER4.COM's templates made everything look like I hired a professional, and my listing presentations improved overnight.
Dana R., Real Estate Agent
Format and industry
How each format and industry performs
Not all visual content performs equally, and effectiveness varies by industry, but the trend is consistent across the board. When you put a well-designed physical piece in someone's hands, they pay attention. Match the right format to the right audience and the numbers follow.
| Format | Where it wins |
|---|---|
| Business cards | The first tactile impression, where color, stock, and typography set credibility instantly. |
| Flyers and postcards | High-volume reach where color raises readership by 40 percent. |
| Brochures | Room to tell a full story with layout, hierarchy, and imagery. |
| Banners and signage | Large-format design that has to read clearly at a glance and from a distance. |
| Menus | Well-designed menus lift per-table revenue by 10 to 15 percent. |
| Industry | How design pays off |
|---|---|
| Professional services | Well-designed cards and stationery raise perceived credibility with new clients. |
| Healthcare | Clear branded materials measurably improve patient trust scores. |
| Hospitality | Menu design directly raises average order value. |
| Real estate | Professionally designed postcards and flyers generate more listings. |
| Retail | Consistent packaging and signage build recognition that drives repeat purchase. |
Your format choice should match your goal. A first impression at a meeting calls for premium business cards. High-volume neighborhood reach calls for flyers or postcards. A full brand story calls for a brochure. Each industry has its own benchmarks, but the common thread is relevance and design quality.
Make it deliberate
Turning color and type into higher response
Design principles are only useful when you apply them on purpose. Color, typography, and hierarchy are the levers that turn a flat layout into a piece people remember, and the research is consistent about how much they move the needle. The tip below is the fastest way to make the data work for your next print run.
Proof, not promises
What design choices look like across our order data
Here are the quality and scale signals from our side of the press, the volume, ratings, and delivery numbers that round out the picture for marketers planning campaigns in 2026 and beyond. A 99.8 percent on-time delivery rate keeps your launch on track, and a 4.8 out of 5 average across 10,000 plus reviews shows the print quality holds up piece after piece.
Stock, finishing and price
What 32pt feels like against 14pt, and what each costs
For businesses ready to act on these numbers, here is current pricing for Standard Business Cards, the piece that carries your first tactile impression, alongside the full specifications so you can match the right stock and finish to your brand.
| Quantity | Price Per Unit | Total |
|---|---|---|
| 100 | 17.6¢ | $17.57 |
| 200 | 11.5¢ | $23.07 |
| 300 | 9.15¢ | $27.46 |
| 400 | 7.96¢ | $31.86 |
| 500 | 7.25¢ | $36.26 |
| 600 | 6.77¢ | $40.64 |
| 700 | 6.43¢ | $45.04 |
| 800 | 6.18¢ | $49.43 |

Wally turns the design data into your next print run
Statistics are step one. A finished, printed piece is step two.
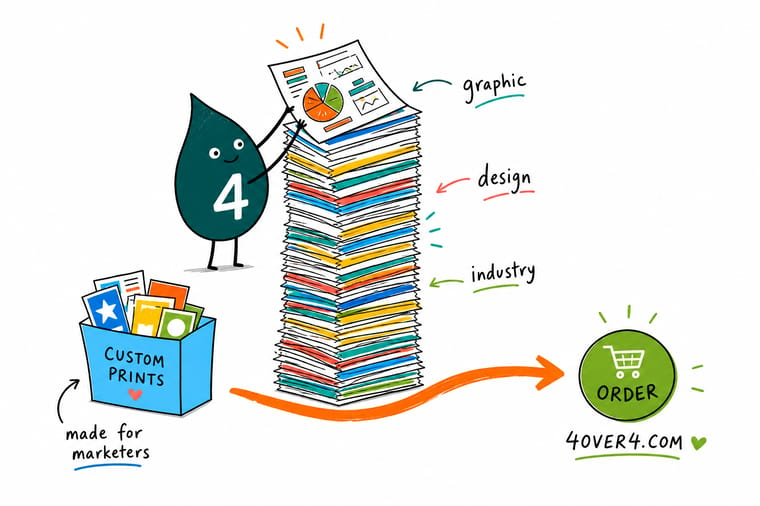
The numbers all point the same way. Strong visuals earn more views, consistent branding earns more revenue, and premium stock earns more trust. Wally's rule is simple. Pick the format that fits your message, design it with real color and type discipline, and print it heavy enough to feel the quality. Color decides up to 90 percent of a snap judgment and full color print is 39 percent more memorable than single color, so on a business card the ink choice is doing more work than the layout.
Print business cards →Start from a blank
Blank templates for print-ready design
Need a head start on artwork? These blank templates make it easy to get your design print-ready, with bleed and safe margins already built in.
Side by side
How visual content types compare in business impact
Graphic design statistics become most useful when you compare formats against each other. Marketers do not operate in a vacuum, and every dollar has to compete for the best return. The comparison below puts print, social visuals, video, and text in context so you can allocate your design budget where it does the most good.
| Format | Attention | Recall | Best for |
|---|---|---|---|
| Print design | High, held and kept in hand | 70 percent higher recall than digital | Cards, mailers, menus, signage |
| Social visuals | 650 percent more engagement than text | Short and scroll-dependent | Reach and awareness |
| Video and motion | Very high inside the feed | Strong when watched fully | Storytelling and demos |
| Text only | Lowest, skimmed fast | Weak without a visual anchor | Detail and reference |
Print materials consistently outperform digital-only approaches for brand recall. A Canada Post neuromarketing study found direct mail requires 21 percent less cognitive effort to process than digital media and produces 70 percent higher brand recall. When the printed piece features strong design, that recall advantage compounds.
Patients who receive well-designed printed reminders follow through on care more often than those who receive plain-text digital messages, a pattern the healthcare marketing statistics reinforce. The takeaway is straightforward. Invest in design quality for the formats your audience actually engages with, which for most businesses means premium print for high-touch moments and clean digital visuals for broad reach.
Myths vs facts
What gets said about design, and what the data supports
A few myths keep businesses from investing in design that would pay off. The pairs below set each common assumption against what the graphic design statistics actually show, so you can plan your next piece on evidence rather than habit.
Good design is just decoration.
Design drives measurable outcomes. Content with relevant images gets 94 percent more views, and brand consistency lifts revenue by up to 23 percent.
Print design is obsolete in a digital world.
Print requires 21 percent less cognitive effort to process and produces 70 percent higher brand recall than digital media.
You need an agency to get professional results.
Proven templates built on real typography, color, and layout principles let small teams print agency-quality pieces without agency budgets.
Color choice is a matter of taste.
Color accounts for up to 90 percent of the snap judgments people make about a product, so palette is strategy rather than decoration.
Print it
The design products businesses reach for most
A design decision ends at a stock choice. Standard Business Cards print 100 for $17.57 in 3 business days, brochures 50 for $57.11, door hangers 250 for $290.41 in 7, and outdoor banners in 3. These are the formats businesses print these findings onto.



Free to start
Layout files sized to each product before you design
Prefer to design from a proven starting point? These free templates give you a ready layout you can customize to your brand and send straight to print.
Why businesses trust us
The press behind these design and print figures
Every benchmark on this page sits on a long record of getting design printed right. A 4.8 out of 5 average across 10,000 plus reviews, 150,000 plus businesses served, and print produced since 1999 are the trust signals behind the numbers, so you can commit to a design knowing the pieces will land sharp and on time.
How we built this
Where each graphic design figure on this page comes from
Every graphic design statistic on this page comes from published research, government data, or 4OVER4.COM's own order and review data spanning 25 plus years and 150,000 plus businesses served. Sources include the Bureau of Labor Statistics, IBISWorld, the Data and Marketing Association, academic research journals, and industry reports from Adobe, Lucidpress, and Venngage. We cross-reference multiple sources before including any data point and update this page as new research becomes available.

Get Started
Print 100 business cards at $17.57 and judge the stock
Pick a format, drop in your design or a free template, and we will print it sharp on premium stock and ship it on time.
Legal Disclaimer
Gold Standard guarantees apply to all standard orders placed through 4over4.com. Price match requires verifiable proof of a competitor's published price for an equivalent product with matching specifications and turnaround time. Satisfaction guarantee covers manufacturing defects and print quality issues. Contact support with order number and documentation. On-time delivery rate based on tracked orders 1999 to 2026. Individual results may vary based on shipping carrier performance.
Explore more
Design guides, print products and visual marketing data
 Graphic Design Terms Every Designer and Print Buyer Should Know A plain English glossary of graphic design terms grouped by basics, image and file types, layout, color, and p
 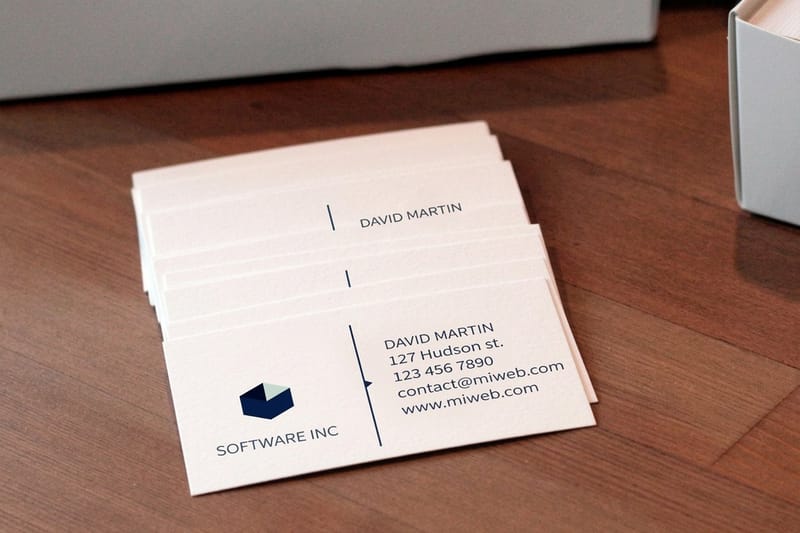 Product Business Cards Print the piece that carries your first tactile impression. Statistics Industry Marketing Statistics The wider hub of marketing benchmarks by sector.
  Statistics Real Estate Marketing How designed postcards and flyers win more listings.
  Statistics Law Firm Marketing Why professional design signals credibility to clients.
  Statistics Healthcare Marketing How clear design improves patient trust and follow-through.
  Statistics Wedding Industry Data Design and print trends across events and invitations.
  Statistics Restaurant Failure Rate Why branded materials help restaurants last longer.
  Templates Blank Templates Print-ready files with bleed and safe margins built in.
  Samples Free Samples Feel the stocks and finishes before you commit. FAQs Printing FAQs Answers on stock, sizes, proofs, and turnaround.
 Questions and answers
Common questions about graphic design data and trends
Industry size, design ROI, print relevance, format choices, and samples, answered.
How large is the graphic design industry?
The U.S. graphic design services industry generates over 15 billion dollars in annual revenue according to IBISWorld. It spans freelance designers, agencies, in-house teams, and print production, and graphic design industry statistics point to steady growth driven by rising demand for visual content across both digital and print channels.
Does professional graphic design actually improve business results?
Yes. Professionally designed materials outperform amateur alternatives in every study worth citing. Content with strong visuals gets 94 percent more views, and brand consistency across designed touchpoints raises revenue by up to 23 percent. Those are not small margins.
Is print design still relevant in a digital world?
Absolutely. Direct mail achieves a 9 percent response rate for house lists compared to email's 1 percent average, and print requires 21 percent less cognitive effort to process while producing 70 percent higher brand recall. Print and digital work best together. Order free samples to feel the difference stock makes.
What visual content marketing statistics matter most for small businesses?
Focus on brand consistency, which lifts revenue by up to 23 percent, color, which drives 90 percent of snap judgments, and format selection. Posts with images earn 650 percent higher engagement, and in print, full-color designs are 39 percent more memorable than single-color alternatives.
How many businesses use visual content in their marketing?
About 90 percent of businesses now build visual content into their marketing according to Venngage. The split between in-house teams, freelancers, and template-based approaches varies, but the direction is clear. Visual content is standard practice, not an optional extra.
What paper and finish choices affect design effectiveness?
4OVER4.COM offers 60 plus paper types because material choice is part of the design. Thicker stocks like 32pt read as expensive in the hand, textured papers add tactile interest, and finishes like spot UV and foil stamping draw the eye to key elements. Browse blank templates to start with the right dimensions built in.
