
Event Marketing Statistics That Shape Strategy in 2026


ROI, trade show performance, promotional products, and booth benchmarks, set against the order data behind 25 plus years of printing event collateral at 4OVER4.
Event marketing works because tangible materials make events stick. The global events industry drives over $1.5 trillion a year, 81 percent of trade show attendees hold buying authority, and 85 percent remember the brand that handed them a printed piece. With 150,000 plus businesses printing with 4OVER4.COM, the data backs up what marketers already feel.
The headline
What a booth returns against what it costs
Event marketing statistics reveal a clear trend. Brands that invest in physical presence at events, through printed materials, signage, and promotional products, see stronger engagement and recall. 4OVER4.COM has printed collateral for 150,000 plus businesses, many of whom rely on trade shows, conferences, and community events to drive growth. Understanding event marketing ROI statistics helps you allocate budgets smarter and choose the right print for every event, and our Loyalty Program adds more value to every order along the way.
By the numbers
Four event figures a booth budget is built on
Here are the headline figures marketers reach for first when they plan a booth, drawn from published industry research and our own production data. In-person events are back, the average attendee visits only 26 exhibits, and the brands that leave something in someone's hand are the ones remembered. Set those benchmarks against 25 plus years of printing event collateral at 4OVER4.COM and the picture is consistent: the pieces people can hold get acted on.

Why the data matters
Why event marketing data matters for your next campaign
Event marketing statistics are not just numbers on a slide deck. They are the foundation for deciding how much to print, which formats to choose, and where to spend your budget. Whether you are setting up a trade show booth or sponsoring a local 5K, the data tells you what earns attention and what ends up in the trash.
4OVER4.COM works with brands across every industry, from startups handing out their first business cards at a pitch night to enterprise teams shipping pallets of brochures for national conferences. Event marketing ROI statistics consistently show that printed collateral outperforms digital-only follow-up on brand recall. For data on another booming events sector, explore our wedding industry statistics page.
The big picture
The state of event marketing: industry numbers you should know
Event marketing industry statistics paint a picture of a sector that rebounded hard since 2021. In-person events are back, hybrid formats are maturing, and brands are spending more on physical touchpoints than they did before the pandemic. The question is not whether to show up. It is how to show up smarter.
According to the Events Industry Council, the global events industry generates more than $1.5 trillion in direct spending every year. That is not a niche channel. It is a massive ecosystem where your printed materials compete for attention against hundreds of other exhibitors, sponsors, and vendors.
Booth performance
Trade show statistics and booth performance
Trade show statistics tell a compelling story about the power of physical presence. According to the Center for Exhibition Industry Research, 81 percent of trade show attendees hold buying authority. That means four out of five people walking past your booth can actually sign a check.
Here is the catch. Attendees visit an average of 26 exhibits per show, so your booth has seconds, not minutes, to make an impression. That is where print quality becomes your silent salesperson. A thick, textured business card or a vivid retractable banner does the talking before you open your mouth.
The cost per lead at trade shows averages around $142, well below the $300-plus of inside sales, which is why companies keep coming back to events. If you are comparing performance across sectors, the restaurant failure rate data shows how food service brands use events and local marketing to build early traction.
ROI in focus
Event marketing ROI statistics: what the numbers actually say
Event marketing ROI statistics are where things get interesting. According to Bizzabo, 95 percent of marketers believe in-person events give attendees a valuable chance to form connections in an increasingly digital world. That is near-unanimous agreement from the people running these campaigns.
The numbers back up the sentiment. Companies that allocate 20 percent or more of their marketing budget to events report higher year-over-year revenue growth than those that do not. Physical interactions build trust faster than any email sequence or social ad.
Print materials drive that return directly. According to the Advertising Specialty Institute, 85 percent of consumers remember the advertiser who gave them a promotional product, compared to 35 to 40 percent recall for a digital ad. A branded pen, a sturdy tote, a well-designed brochure all carry staying power that pixels do not.
We ordered banners, business cards, and postcards from 4OVER4.COM for our annual tech expo. The quality made our booth look like a Fortune 500 company on a startup budget.
Verified customer, verified buyer
Tangible marketing
Promotional products statistics and tangible marketing
Promotional products statistics reinforce what event marketers have known for years. People keep things they can touch. The Advertising Specialty Institute reports that promotional products generate roughly 500 impressions per item over their lifetime. A branded notebook handed out at a conference keeps working every time someone opens it at their desk.
The most effective promotional items are wearables like hats and shirts, followed by writing instruments and bags. Printed materials serve a different job. High-quality business cards, brochures, and postcards carry your message, your offer, and your contact details. They are the bridge between a handshake and a signed contract.
For real estate professionals working events and open houses, our real estate marketing statistics page digs deeper into how print drives property inquiries.
I handed out 500 postcards at a regional conference last spring, got 47 direct inquiries, and closed 8 new clients. The cards paid for themselves before I left the parking lot.
Verified customer, verified buyer
Format trends
Event attendance and format trends
The event landscape keeps shifting. According to Eventbrite research, 72 percent of event creators plan to host more in-person events than the year before. Hybrid events have not disappeared, but the pendulum has swung back toward physical gatherings.
This matters for print planning. In-person events demand tangible materials. You need banners for the booth, flyers for the registration table, business cards for every team member on the floor, and signage that reads from 30 feet away.
The average attendee at a B2B event interacts with 5 to 7 brands they had not previously considered. That is your window, and the brands that leave a physical impression are the ones remembered after the event fog clears.
Follow-up
Print plays the decisive role in event follow-up
Here is a stat that changes how you think about events. According to the Center for Exhibition Industry Research, 80 percent of trade show leads never receive follow-up. That is a staggering waste. The companies that do follow up, especially with a physical mailer or a personalized postcard referencing the event, see conversion rates 3 to 5 times higher than email-only follow-up.
Print bridges the gap between nice to meet you and let us do business. A follow-up postcard with a specific offer, printed on thick stock with a soft-touch finish, does not land in a spam folder. It sits on a desk and gets noticed.
Legal teams attending industry conferences see the same pattern. Our law firm marketing statistics page covers how attorneys turn event connections into retained clients.
Budget planning
Budget allocation across event types
Not all events are created equal, and your print budget should reflect that. A local networking mixer needs 200 business cards and maybe a tabletop banner. A national trade show might call for 5,000 brochures, a 10-foot backdrop, retractable banners, and branded giveaways.
According to Statista, the average B2B company spends between $15,000 and $35,000 per trade show appearance, including booth, travel, and materials. Print typically accounts for 10 to 15 percent of that budget, and smart marketers front-load it because it is the one element that keeps working after the event ends.
Our business cards and full print range mean you can source everything for your event from a single printer, which keeps your brand consistent across every touchpoint. Browse the full set of industry marketing statistics to see how different sectors approach event print.
Side by side
How event channels compare on attention and recall
Event marketing statistics become most useful when you compare channels side by side. The data consistently shows that physical materials outperform digital-only approaches for brand recall and lead quality at events. The comparison below puts print, promotional products, email, and digital ads in context so you can plan your booth budget with clear eyes.
| Channel | Attention at events | Recall | Cost | Follow-up value |
|---|---|---|---|---|
| Printed collateral | Held in hand at the booth | 85% remember the giver | About $142 per lead | Sits on a desk for weeks |
| Promotional products | Kept and reused daily | About 500 impressions each | Varies by item | Long lifespan, high recall |
| Email follow-up | Crowded, easy to ignore | 35-40% ad recall | Low per send | 80% of leads get none |
| Digital ads | Scrolled past quickly | 35-40% recall | Low per impression | No physical presence |
Physical materials win on attention, recall, and follow-up value. Digital wins on speed and cost per impression. The smartest event marketers use both, pairing a booth handout with one digital touch so the conversation continues after the show floor clears.
For a look at how these patterns play out in medical conferences and healthcare trade shows, check our healthcare marketing statistics page.
Myths vs facts
What exhibitors assume about booth spend
A few myths keep marketers from running events that would pay off. The pairs below set each common assumption against what the event marketing statistics actually show, so you can plan your next booth on evidence rather than habit.
Digital ads reach event prospects better than print.
85 percent of consumers remember the advertiser who handed them a promotional product, against 35 to 40 percent recall for a digital ad.
Trade show ROI cannot be measured.
Track cost per lead near $142, booth traffic, and conversions, then add show-specific QR codes or offer codes for batch-level numbers.
Events only pay off for enterprise budgets.
A local mixer runs on 200 business cards and a tabletop banner, and concentrated local audiences often deliver the strongest response per dollar.
Once the show ends, the printed materials are done.
Promotional products generate roughly 500 impressions per item over their lifetime, so a branded piece keeps working long after the booth comes down.
Proof, not promises
What booth print orders show on stock and speed
Here are the figures on event and print performance from our side of the press, the volume, delivery, and quality signals that round out the picture for marketers planning shows in 2026 and beyond. A 99.8 percent on-time delivery rate keeps your booth stocked before doors open, and a 4.8 out of 5 rating across 10,000 plus verified reviews shows the print quality holds up piece after piece.
We have used 4OVER4.COM for three consecutive trade shows now. The retractable banners and thick business cards always get compliments. Our booth looks polished every single time.
Verified customer, Events Manager
Wally turns the event data into your next booth
Statistics are only step one. The booth is step two.
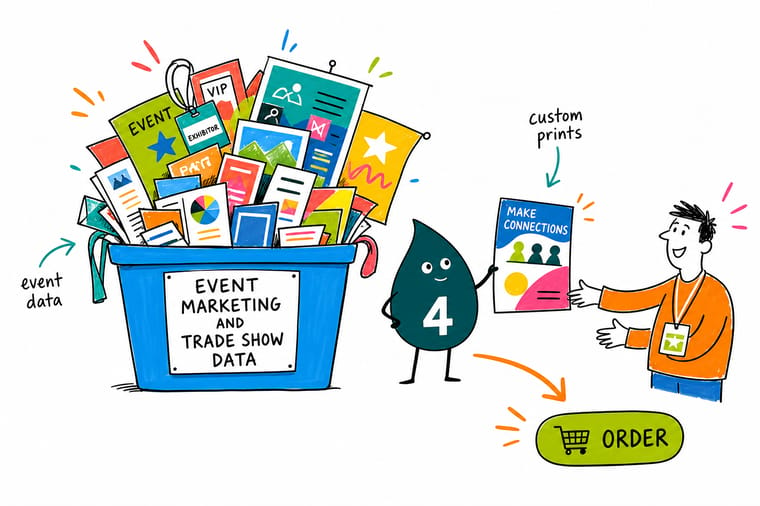
The numbers all point the same way. A premium piece in someone's hand at the show beats a message lost in their inbox afterward. Wally's rule is simple. Match the format to the event, print it heavy on the stock that signals quality, and prepare the follow-up before doors open. An attendee stops at about 26 booths and 80 percent of leads never hear back, so the card you hand over is often the only part of your 142 dollar lead that survives the trip home.
Order business cards →Print it
Cards, posters and stickers that leave the booth
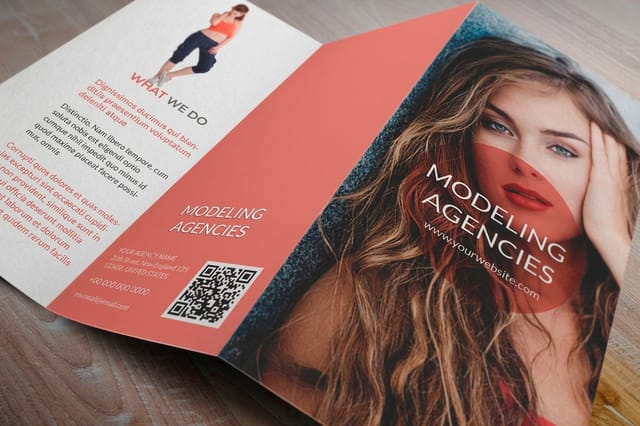
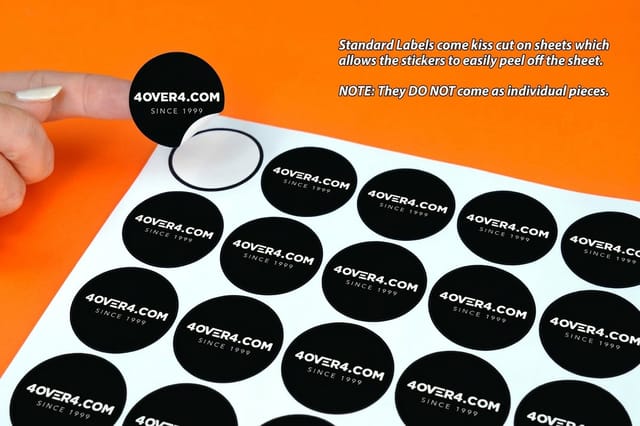
A booth is a set of printed pieces on a fixed date. Standard Business Cards print 100 for $17.57 in 3 business days, posters 50 for $108.75 in 5, brochures 50 for $57.11, and stickers 25 for $23.88. These are the pieces exhibitors order first.



Stock, finishing and price
The card that survives a show floor, priced at 100
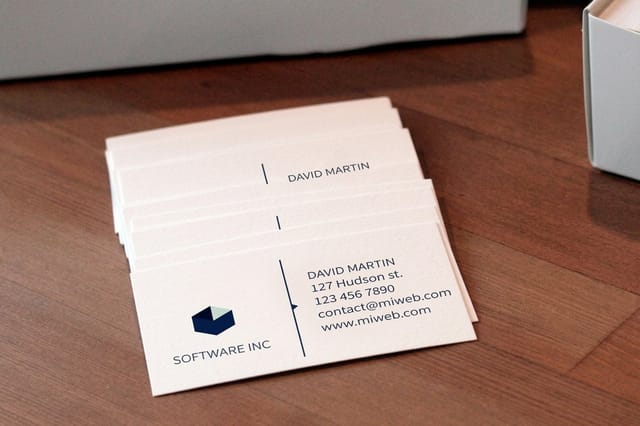
For teams ready to act on these numbers, here is current pricing for Business Cards, the piece every attendee walks away with, alongside the full specifications so you can match the right stock and finish to your event.
Start from a blank
Booth templates sized to trim before you design
Each template opens at the finished size with the bleed and safe margins already drawn, so a booth set can be laid out once and sent to press without a rebuild.

Ready-made designs
Free event badge templates to customize
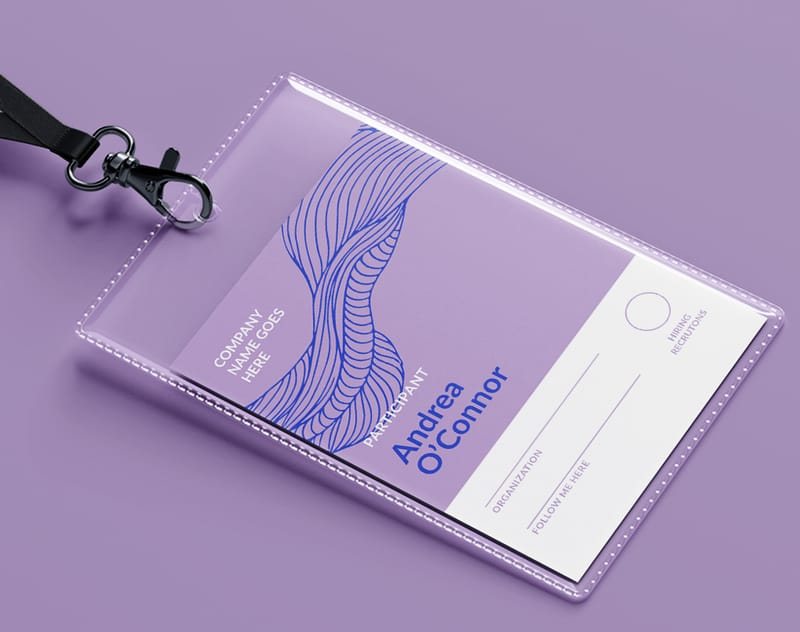
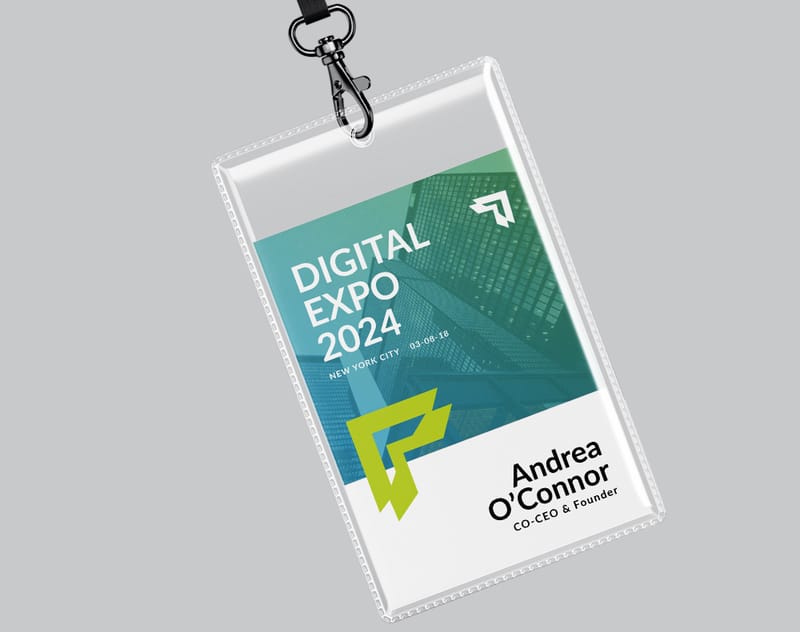
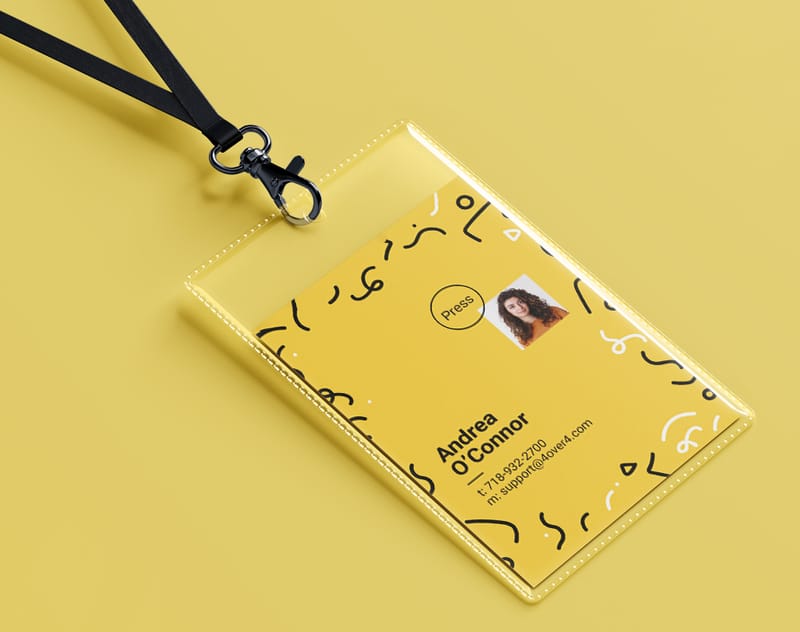
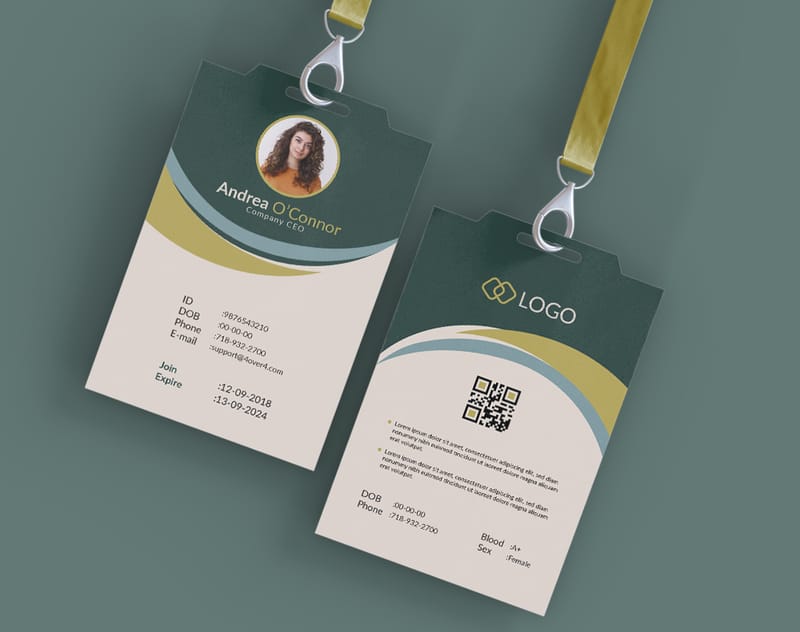
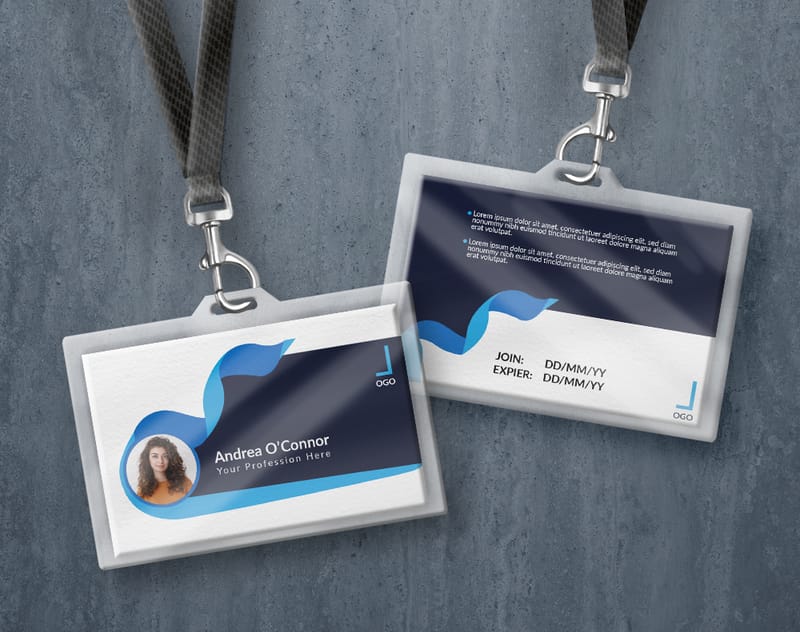
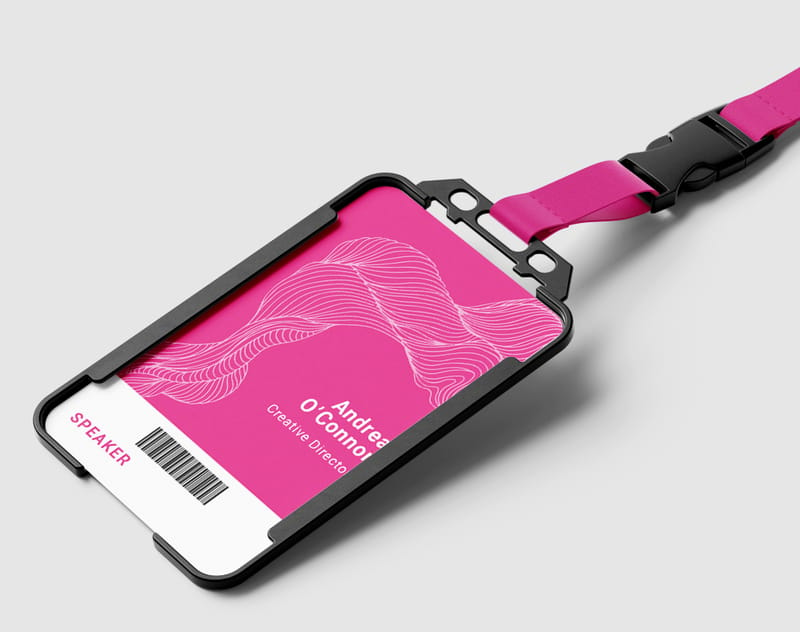
Open any of these event badge designs in the online designer and make it yours in minutes, then print it on the stock and finish that fits your show.
Why marketers trust us
The press behind these trade show figures
Every benchmark on this page sits on a long record of getting event print right. A 4.8 out of 5 average across 10,000 plus reviews, 150,000 plus businesses served, and print produced since 1999 are the trust signals behind the numbers, so you can plan a show knowing the pieces will land sharp and on time.
How we built this
Where each event marketing figure here comes from
The event marketing statistics on this page come from published research by recognized industry organizations including CEIR, Bizzabo, ASI, Eventbrite, the Events Industry Council, and Statista. 4OVER4.COM cross-references these sources with internal order data from 150,000 plus business clients and 10,000 plus reviews. All figures reflect the most recently available data, and we update this page as new research becomes available to keep event marketing industry statistics accurate and actionable.

Get Started
Print 100 show cards for $17.57 in 3 business days
Pick a format, drop in your design or a free template, and we will print it sharp on premium stock and ship it before your show opens.
Legal Disclaimer
Gold Standard guarantees apply to all standard orders placed through 4over4.com. Price match requires verifiable proof of a competitor's published price for an equivalent product with matching specifications and turnaround time. Satisfaction guarantee covers manufacturing defects and print quality issues. Contact support with order number and documentation. On-time delivery rate based on tracked orders 1999 to 2026. Individual results may vary based on shipping carrier performance.
Explore more
Event marketing guides, booth print products and benchmarks
Statistics Industry Marketing Statistics The full hub of print benchmarks by industry and sector.  Statistics Wedding Industry Statistics Data on another booming events sector and its print demand.
  Statistics Real Estate Marketing Statistics How agents use print at open houses and local events.
  Statistics Healthcare Marketing Statistics Print patterns across medical conferences and trade shows.
  Statistics Law Firm Marketing Statistics How attorneys convert event connections into clients.
  Statistics Restaurant Failure Rate Data How food brands use events to build early traction.
 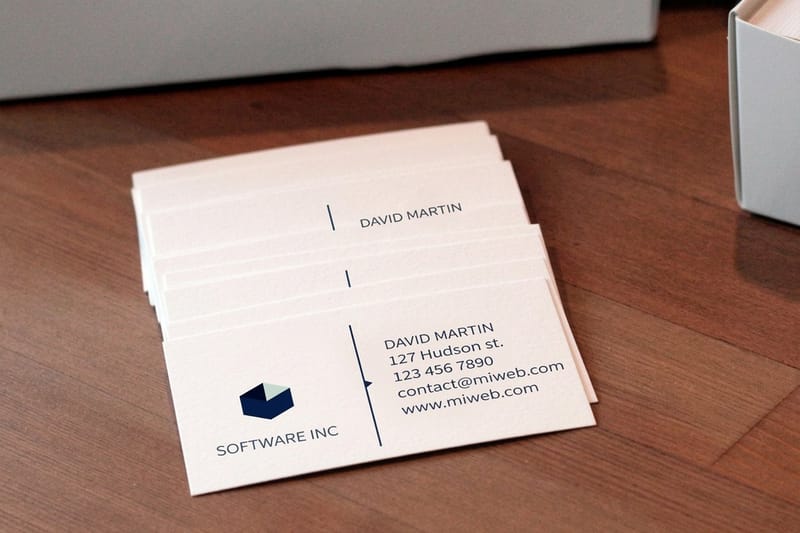 Product Business Cards The card every attendee walks away with from your booth.
  Templates Event Badge Templates Print-ready badge layouts with bleed and safe margins built in.
  Guides Printing Guides Step-by-step help designing and printing event collateral. FAQs Printing FAQs Answers on stock, sizes, proofs, and event turnaround.
 Questions and answers
Common questions about event marketing data and print ROI
Trade show benchmarks, promotional products, ROI, quantities, and samples, answered.
What are the most important event marketing statistics for planning a trade show?
The most actionable trade show statistics center on attendee buying authority, where 81 percent hold purchasing power, cost per lead at roughly $142, and follow-up, where 80 percent of leads never get contacted. Together they tell you how many printed pieces to order and which formats, from business cards to brochures to banners, will earn the best return on your booth.
How do promotional products statistics compare to digital advertising at events?
Promotional products generate about 500 impressions per item over their lifetime, and 85 percent of people remember the brand that handed them one. Digital event ads typically see 35 to 40 percent recall. Print and promotional items create a tactile memory that a screen cannot match, which makes them a stronger long-term investment for event marketing.
What event marketing ROI statistics justify spending on premium print materials?
Companies that put 20 percent or more of their marketing budget into events report higher revenue growth. Within that spend, premium printed materials such as thick business cards, spot UV brochures, and heavy banners correlate with better lead quality, because attendees read print quality as a signal of brand credibility. A flimsy card gets tossed and a sturdy one gets kept.
How many printed materials should I bring to a trade show?
Plan for about 1.5 times the expected attendee count for business cards and brochures, so a show expecting 2,000 attendees calls for at least 3,000 pieces. Running out mid-show costs you leads you will never recover. Order free samples ahead of time to confirm your paper and finish choices.
Are in-person events still growing in 2026?
Yes. Eventbrite research shows 72 percent of event creators plan to host more in-person events than the year before. The hybrid model has supplemented physical gatherings rather than replacing them, which keeps demand high for banners, signage, handouts, and business cards.
What is the average cost per lead at trade shows compared to other channels?
Trade show data from the Center for Exhibition Industry Research puts the average cost per lead near $142, while inside sales leads run $300 or more and some digital channels cost even more. Events remain one of the most cost-effective lead sources, especially when you pair them with quality print that extends the conversation beyond the show floor.
