
5 Numbers Every E-Commerce CFO Must Know


Revenue and gross margin are the two numbers an online store reports and the two that mislead it most. These five carry the actual decisions: what to spend, what to stock, what to fix.
The five are contribution margin per order, CAC payback period in months, 90-day repeat purchase rate by cohort, cash conversion cycle in days, and return rate measured in both units and dollars. Together they answer whether each order leaves money behind, how long your cash is out before it returns, whether customers come back, how many days your money sits in stock, and how much of your revenue quietly reverses. Gross margin and revenue answer none of those.
Quick answer
Why gross margin is the number that lies
Gross margin stops measuring before most of the money leaves. An order can carry a 70 percent gross margin and keep 14 percent once packaging, shipping, payment fees and acquisition come out, and only that last slice pays rent, salaries and tax. The waterfall below shows exactly where the difference goes on a single order, which is the same arithmetic behind all five numbers on this page.
1. Contribution Margin Per Order, Not Gross Margin

This is the number that decides whether growth helps or hurts. Gross margin removes the product cost and stops. Contribution margin keeps subtracting until nothing variable is left: pick and pack labor, the box, the filler, outbound shipping, the processor fee, and the ad spend that bought the order.
Run one order through it. Sell for $60 with an $18 product cost and gross margin reads a comfortable 70 percent. Take out $9.50 of pick, pack and shipping, $2.04 in card fees, and $22 of acquisition, and the order keeps $8.46. That is 14 percent, and $8.46 is the only money that ever reaches rent, salaries, software and tax. Two stores can report the same gross margin and one of them is quietly funding its own customers.
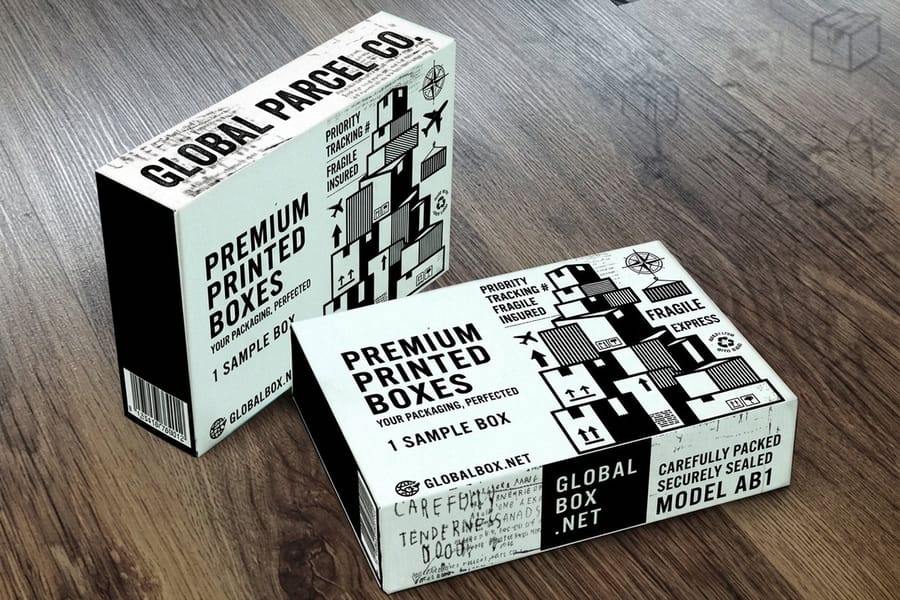
The judgment call is which costs you allocate, and the trap is moving them. Fulfillment packaging belongs in cost of goods where it drags on the margin you can see. Custom tissue paper starts at $126.32 and shipping boxes at $711.78, so on a low order value store the wrap alone can be a point or two of margin. Promotional print, an insert or a voucher, is a retention spend and belongs in marketing. Pick a split, write it down, and keep it for the full year, because reclassifying halfway through makes every trend line worthless.
One more habit worth building: calculate contribution margin per order by channel and by product category, not just company wide. The blended figure hides the category that only ever breaks even, and the average keeps looking fine while one line drains it.
2. CAC Payback Period In Months

Payback is the honest version of the acquisition question. Divide the cost to acquire a customer by the contribution margin that customer produces in a month, and you get the number of months before the cash comes back. Everything about your financing depends on it.
Report two versions. Blended CAC is all acquisition spend divided by all new customers, organic included, and it is the figure a lender or a board should see. Paid CAC is what the next customer costs at the margin, and that is the one you compare against contribution margin before you approve more budget. A team that reports only the blended number can lose a channel entirely and not notice for a quarter.
Payback with no cash context is a half answer. Twelve months is fine for a business with 60 day supplier terms and money in the bank. The same twelve months funded on a credit line at 14 percent is a slow bleed, because you are paying interest on every customer for a year before they clear. State the payback and the funding cost in the same sentence or the number can be read either way.
Channels with a fixed unit cost are useful here precisely because the math holds still. A mailing of direct mail postcards starting at $89.68 has a known cost per piece and a countable response, so the CAC it produces is measured rather than modeled. The direct mail services collection covers the formats, and our guide to starting an e-commerce business sets out the cost base those channels have to clear.
3. Repeat Purchase Rate At 90 Days, By Cohort

Group customers by the month of their first order and follow each group forward. Of the customers who first bought in January, how many bought again within 90 days? That single percentage moves everything downstream, because it is the input that turns a one time sale into a payback period you can survive.
Do not use the aggregate repeat rate. It rises automatically whenever new customer growth slows, since the denominator stops filling with first timers, so it looks best in the month a store starts stalling. Cohort tables have no such flattery. Read them down the column and you see whether the product is holding people, and read them across the row and you see whether last quarter's changes did anything.
The lever is usually the delivery moment, and it is cheap. A card in the box with a reorder reason, a size guide or a care instruction costs less than a click. Ecommerce thank you cards start at $19.77, which is a rounding error against a paid CAC in the tens of dollars, and unlike an email it arrives in the customer's hands with the product. The honest caveat: an insert lifts a good product's repeat rate and does nothing for a bad one. If people are not reordering because the item disappointed them, print will not fix it.
For what to actually put on the card, see the guide to packaging inserts that drive repeat sales, and the customer retention benchmarks page for how retention economics behave at scale.
4. Cash Conversion Cycle In Days

Inventory days plus receivable days minus payable days. The result is how many days your cash sits inside stock and shipments before it comes back as money, and it explains the thing that surprises founders most: a profitable store running out of cash.
Most direct to consumer stores collect at checkout, so receivable days are near zero and the whole cycle is a fight between two levers. Inventory days come down by ordering smaller and more often, which raises unit cost. Payable days go up by negotiating terms, which usually costs you a discount. Both trades are real, and the right answer depends on what money costs you right now.
| Lever | What it does to the cycle | What it costs | When it is worth it |
|---|---|---|---|
| Smaller, more frequent buys | Cuts inventory days. | Higher unit cost, more stockout risk. | When cash is tight or demand is uncertain. |
| Supplier terms of 30 to 60 days | Adds payable days, sometimes turning the cycle negative. | Usually the early payment discount. | When the discount is smaller than your cost of capital. |
| Bulk buying to hit a price break | Adds inventory days. | Cash locked in stock for months. | Only on proven sellers with steady demand. |
| Preorders and made to order | Collapses the cycle toward zero. | Longer delivery times, more cancellations. | On launches and high value custom items. |
Consumables follow the same logic as product stock. Print supplies bought in one large run cost less per unit and sit on a shelf for months, and print bought in small runs costs more per unit and frees the cash. Neither is the correct answer. Model the cycle forward before the buy, not after, because inventory purchasing is the single decision that moves this number most.
5. Return Rate, In Units And In Dollars
Track returns two ways, because the unit count and the dollar cost move independently. A 12 percent unit return rate looks survivable until you price a single return properly: the return shipping, the labor to inspect and restock, and the units that come back unsellable at full price. On a thin margin category that combination can take the category below zero while the top line still grows.
Then break it down by reason, because the reasons split into two piles. Some returns are the cost of doing business online and no process fixes them. The rest are avoidable, and they cluster in a small number of causes: wrong size, an item that did not match the listing photo, damage in transit, and confusion about what was in the box.
The avoidable pile is where operations meets print. Sizing printed on the product label instead of buried in a listing, care instructions that stay with the item, a clear contents label on multi item shipments, and packaging that survives the carrier all remove a slice of the avoidable returns. Die-cut labels start at $93.37 and the packaging and labels hub covers the formats. Accurate addressing belongs in the same bucket, since undeliverable parcels come back as returns with none of the sales value, which our guide to addressing e-commerce shipments covers in detail.
One warning about a falling return rate. It is not always good news. Some disappointed customers never file a return, they simply do not order again, so a return rate that drops while the 90-day repeat rate drops with it is a warning, not a win. That is why these five numbers are read together and never one at a time.
The monthly one-pager
All five on a single sheet
A finance pack that runs to forty slides gets skimmed. These five fit on one page, and each one has a source system, a review rhythm, and a specific decision it drives.
| Number | How it is calculated | Where it comes from | The decision it drives |
|---|---|---|---|
| Contribution margin per order | Revenue less product cost, fulfillment, shipping, payment fees and acquisition. | Order export joined to the ad platforms and the 3PL invoice. | Pricing, free shipping thresholds, which categories to grow. |
| CAC payback | Acquisition cost divided by monthly contribution margin per customer. | Ad spend, new customer count, cohort revenue. | How much budget the next month can carry. |
| 90-day repeat rate | Share of a first-order cohort that buys again within 90 days. | Cohort table built from first-order date. | Retention spend, insert and email programs, subscription tests. |
| Cash conversion cycle | Inventory days plus receivable days minus payable days. | Inventory reports, bank feed, accounts payable ledger. | Purchase order size, supplier terms, credit line need. |
| Return rate | Returned units over units shipped, and returned dollars over revenue. | Returns portal, by SKU and by stated reason. | Listing fixes, labeling, packaging spec, delisting a SKU. |
Two rules keep the page useful. Every number gets one owner, and every number gets a prior-period comparison next to it, because a level with no direction is not information. If a metric has never once changed a decision, take it off the page.
Wally explains the five numbers
One order, five questions, one page
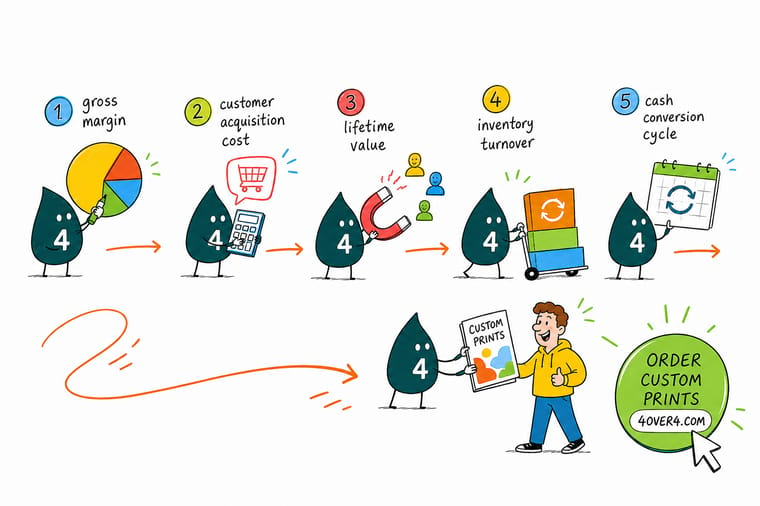
Wally sells a $60 order and lines the coins up. Product cost takes one. Box, filler and shipping take another. The card processor takes a small one. Advertising takes the biggest. What is left standing is contribution margin, and that is the only coin that pays the rent. Then he asks four more questions about it: how many months until that coin comes back, does the customer buy again inside 90 days, how many days is his cash stuck in boxes, and how much of it reverses as returns. Five answers on one page, checked every month.
Shop e-commerce printing →Specs and pricing
The print line items, with live starting prices
Three of the five numbers move on things you print: the insert in the box, the mail piece that acquires, the label that prevents a return. Configure each one and the real cost lands in your margin model instead of an estimate.



Print it
Print that shows up in the numbers



Explore more
Where to go next






By the numbers
The print partner behind the line items
Common Questions
E-commerce finance questions, answered
What is the difference between gross margin and contribution margin?
Gross margin takes the cost of the product out of the sale price and stops there. Contribution margin keeps going: it also removes pick and pack labor, the box and filler, outbound shipping, the payment processor fee, and, in the version most e-commerce operators use, the advertising spend that bought the order. Gross margin tells you whether the product is priced above its cost. Contribution margin tells you whether the order left any money behind for rent, salaries and software. They can be 50 points apart on the same sale.
How do I calculate CAC payback when paid and organic orders are mixed?
Use blended CAC for the number you report and paid CAC for the number you use to decide on spend. Blended CAC is total acquisition spend for the month divided by new customers acquired that month, organic included. It answers the question a lender or a board asks, which is what it costs this business to add a customer. Paid CAC divided by the same period gives you the marginal cost of the next customer, and that is the one you compare against contribution margin before raising a budget. Reporting only the blended figure hides a channel that has stopped working.
Is LTV to CAC a useful ratio for a young store?
Not yet, and leaning on it early is a common way to talk yourself into overspending. Lifetime value needs enough purchase history to model a repeat curve, and a store with three quarters of data does not have one. Until then, use realized 90-day value per customer, which is money that has already arrived, and CAC payback in months. When you have two years of cohorts, an LTV model becomes worth building, and you should still report the realized figure next to it.
Does packaging belong in cost of goods or in marketing?
Put the functional part in cost of goods and the promotional part in marketing, then never move an item between them again. The box, the void fill and the shipping label are fulfillment costs, so they sit in cost of goods and pull down contribution margin where you can see them. A printed insert, a thank you card or a discount voucher is a retention spend and belongs in marketing. The exact split matters less than holding it steady, because reclassifying costs mid year makes every trend line meaningless.
What return rate should worry an e-commerce CFO?
There is no single threshold, because apparel and electronics live in different worlds. The threshold that matters is the point where return-adjusted contribution margin on a category goes negative, and you can calculate that for your own catalog: multiply the return rate by the full cost of a return, which is the return shipping, the inspection and restock labor, and the units you cannot resell at full price. A low return rate is not automatically good either. Some customers do not bother returning a disappointing item, they just never order again, which shows up in the 90-day repeat rate instead.
How often should these five be reviewed?
Contribution margin per order and CAC payback get looked at monthly, alongside the close. Cohort repeat rate is a quarterly review because 90-day cohorts need a quarter to mature. Cash conversion cycle should be watched monthly and modeled forward before any inventory buy, since that is the decision that moves it. Return rate is monthly by category, not just at the company level, because a company-wide figure hides the one SKU doing the damage.
Get Started
Put the print line items on a real number
Configure the insert, the mailer and the label, get the live price, and drop it straight into your contribution margin model instead of an estimate.
Legal Disclaimer
Gold Standard guarantees apply to all standard orders placed through 4over4.com. Price match requires verifiable proof of a competitor's published price for an equivalent product with matching specifications and turnaround time. Satisfaction guarantee covers manufacturing defects and print quality issues. Contact support with order number and documentation. On-time delivery rate based on tracked orders 1999 to 2026. Individual results may vary based on shipping carrier performance.
