
Master the Paid Marketing Metrics That Decide Where Your Budget Goes


Six metrics run a paid budget, and they are links in one equation rather than six opinions. They connect in a fixed order, one of them decides spend, and the offline half of the plan can be measured with the same rigor.
The paid metrics worth reporting are CPM, CTR, CVR, CPA, ROAS and contribution margin, and they form one chain: CPA equals CPM divided by 1,000 times CTR times CVR. Budget decisions are made on the marginal return and on contribution margin, never on average ROAS, because a ratio can look strong on a campaign too small to matter. Breakeven ROAS is one divided by your gross margin, so it is arithmetic rather than a benchmark, and any channel you cannot instrument with a code, a tracked URL and a holdout will be cut for the wrong reason.

Quick answer
One equation, three places a campaign can break
CPA equals CPM divided by 1,000 times CTR times CVR. That identity is why a rising cost per acquisition is always traceable: attention got more expensive, the creative stopped earning clicks, or the page stopped closing them. ROAS sits on top of it as a revenue ratio, and contribution margin sits above ROAS as the only number your bank account agrees with. Report the chain, decide on the margin, and instrument every channel, including the printed ones, so nothing gets cut for being unmeasured rather than unprofitable.
Every Paid Metric Is a Link in One Chain

Most reporting problems come from treating the dashboard as a list of independent numbers. It is not a list. It is one equation, and once you can write it down, every argument about performance gets shorter.
Start at the top. You buy impressions, and CPM is their price. Some fraction of the people who see the ad click, and that fraction is CTR. Some fraction of clickers convert, and that fraction is CVR. Multiply the two fractions and divide the price of attention by the result, and you have your cost per acquisition. Written out: CPA equals CPM divided by 1,000 times CTR times CVR.
That identity is the whole reason a rising CPA is diagnosable. There are exactly three inputs. Attention got more expensive, the creative stopped earning clicks, or the page stopped closing them. Nothing else can move it. A team that knows which of the three moved fixes the right thing in an afternoon; a team that only sees CPA rewrites the ad copy when the problem was a checkout error.
| Metric | What it measures | What moves it | What it hides |
|---|---|---|---|
| CPM | The price of one thousand impressions. | Auction competition, audience size, seasonality, frequency caps. | Whether the impressions reached anyone who would ever buy. |
| CTR | Clicks divided by impressions. | Creative, offer, placement, audience match, creative fatigue. | Curiosity clicks from an audience with no intent. |
| CVR | Conversions divided by clicks. | Landing page, price, form length, stock availability, traffic quality. | A broken step later in the funnel that never becomes revenue. |
| CPA | Spend divided by attributed conversions. | All three metrics above, plus the attribution window. | Order value, so a cheap conversion can still be a bad one. |
| ROAS | Attributed revenue divided by spend. | Order value, discounting, attribution settings, returns. | Cost of goods, so a high ratio can sit on a loss. |
| Contribution margin | Revenue minus cost of goods, shipping, fees and the ad spend. | Everything above, plus pricing and fulfilment. | Very little. This is the number the bank account agrees with. |
Read the last column before the second. Each metric is honest about one thing and silent about another, which is why no single one runs a budget. The chain works because the blind spot in each link is covered by the next.
ROAS Is a Ratio and Profit Is a Number

A ratio can look excellent while the business earns nothing. Six times return on five hundred dollars is three thousand dollars of revenue. Two and a half times on forty thousand dollars is a hundred thousand. If the margin covers the second one, the second one is the better campaign, and the account with the prettier ROAS is the one starving.
Two corrections make ROAS usable. The first is a breakeven line you calculate rather than borrow. Divide one by your gross margin: at 40 percent, breakeven is 2.5x, and that is before rent, salaries or software. Every published benchmark ignores your margin, so it cannot tell you anything about your account.
The second correction is marginal thinking. Average ROAS describes money already spent. The only question a budget meeting asks is what the next dollar returns, and that number is always lower than the average once a campaign has taken the cheap conversions. You find it by moving the budget deliberately, holding creative and targeting still, and reading what the increment produced. When the marginal return crosses your breakeven line, you have found the ceiling of that channel, and pushing past it buys revenue at a loss.
Blended efficiency keeps everyone honest while that happens. Total revenue divided by total advertising spend cannot be double counted by a platform and does not move when someone changes an attribution setting. It will not tell you which channel to cut, but it will tell you instantly if the sum of your optimistic channel reports has drifted away from reality.
Channels with a hard floor cost behave differently here, and print is the clearest example. A paid social campaign can spend a hundred dollars; a mail drop cannot, because print and postage set a minimum before a single response arrives. Direct mail postcards start at $89.68 and standard flyers at $39.54 at 4OVER4.COM, and the cost per piece breakdown shows how print, postage and list rental combine into the denominator you divide responses by. Budget that floor as a test cost, not as a failure, because the first drop is what buys you the response rate you will use for every drop after it.
Measure Print and Offline With the Same Discipline

Print gets cut in budget reviews more often than it deserves, and usually not because it performed badly. It gets cut because nobody instrumented it, so it arrives at the meeting with a cost and no number beside it while every digital channel arrives with a dashboard.
Four instruments fix that, and all four go on the artwork before it prints.
- A code that exists nowhere else. One code per creative and per drop, never reused. Redemptions are your floor, not your total, because a real share of people who saw the piece will buy without ever typing it.
- A dedicated URL behind the QR. Point the QR at a short vanity address that redirects to a tagged landing page, so scans land in analytics as their own campaign rather than as direct traffic. Our guide to QR codes that actually get scanned covers placement and the size a scanner needs.
- A phone number used only on that piece. Calls are the response type print is best at and analytics is worst at seeing.
- A holdout. Split the list, mail most of it, and deliberately mail nothing to a matched slice. The difference in revenue between the two groups is the lift, and it includes every buyer who never touched a code.
The holdout is the part people skip and the part that makes the whole exercise trustworthy. Without it you are measuring how many people remembered a coupon. With it you are measuring what the mailing caused. Keep the two groups matched on the things that predict spending, which usually means recency and past order value rather than geography alone. Building or renting the list is where that split gets designed, and it is far easier to do before the file goes to print than after.
Formats change what you can measure. Postcards need no envelope, which means the offer is read even by people who never respond, and they start at $16.48 for standard postcards. Flyers handed out or dropped in person are cheap enough to test three offers at once, which makes them a fast way to find the message you then mail at scale. Brochures carry more explanation and suit a considered purchase, at the cost of a slower read. The direct mail services collection prints, addresses and mails in one pass, and how direct mail marketing works walks the sequence from list to mailbox.
Diagnose a Rising CPA Before You Cut the Budget

When CPA climbs, the instinct is to pause the campaign. Pausing removes the symptom and the data at the same time. Decompose first, using the identity from the top of this page, because only three things can have moved.
CPM rose. More bidders, a smaller audience, a seasonal auction, or frequency climbing because the audience is too small for the budget. Check frequency before anything else. When the same people see an ad for the fourth time in a week, CPM rises and CTR falls together, which is a targeting problem dressed as a creative problem.
CTR fell. Usually fatigue. The same creative against the same audience decays predictably, and the fix is new creative rather than a bid change. If CTR fell while CPM held steady, the ad stopped being interesting, not expensive.
CVR fell. Check the page and the offer before blaming traffic. A stock outage, a form field added last Tuesday, a price change, a payment method that broke on mobile. This is the link that most often has a mechanical cause and the one teams check last.
Two reporting traps sit on top of the diagnosis. The first is the attribution window: switching from a one day view to a seven day click setting changes reported ROAS without changing a single sale, so freeze the window before comparing periods. The second is timing. Attribute results to the week the money was spent, not the week the order arrived, or a healthy campaign with a three week sales cycle will look broken every time you check it early.
When the argument is about whether a channel causes sales at all rather than how efficiently, the answer is a holdout, and geography is the easiest way to build one. Run the channel in one set of matched towns and not in another, then compare total revenue rather than tracked conversions. Door hangers suit this test because delivery is inherently geographic, though the run size sets a real minimum at $290.41, so plan the test to cover a route rather than a handful of streets. The same logic applies to brand search and to retargeting, where the traffic would often have arrived anyway. For the wider argument about which channel earns the budget, digital versus traditional marketing and improving direct mail response are the two worth reading next.
Wally explains the metric chain
A thousand impressions in, one profitable order out
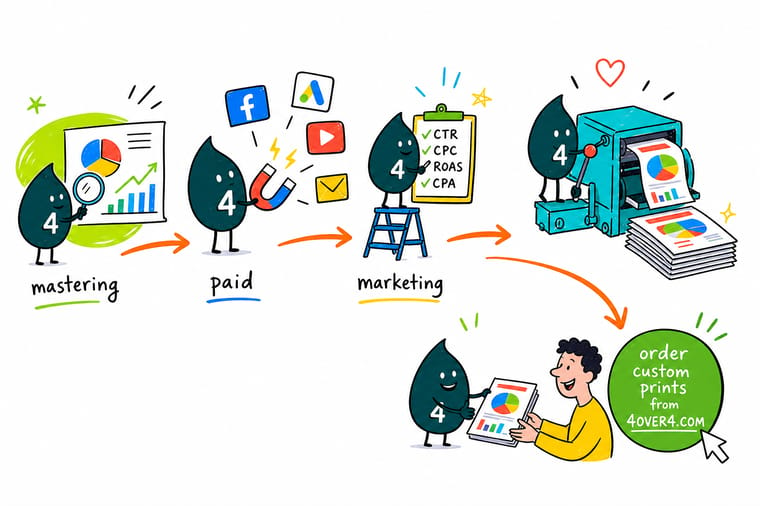
Wally buys a thousand impressions and pays CPM for them. A slice clicks, and that slice is CTR. A slice of those buy, and that slice is CVR. Divide what he paid by the two slices together and he has his cost per acquisition. Then he subtracts what the product cost him, because a ratio never paid an invoice. When the number goes the wrong way he checks three things in order: did attention get dearer, did the ad get boring, or did the page break.
Print a trackable direct mail postcard →Specs and pricing
The offline formats worth instrumenting, with live prices
Sizes, stocks and starting prices straight from the 4OVER4.COM configurator, so the cost side of your offline cost per acquisition comes from a real quote rather than an estimate.



Print it
Put a measurable piece in the field



Explore more
Where to go next





By the numbers
The print side of your marketing plan, handled
Common Questions
Your paid metrics questions, answered
Which paid marketing metrics should I actually track?
Six, in this order: CPM tells you what attention costs, CTR tells you whether the creative earns the click, CVR tells you whether the landing page and offer close it, CPA tells you what a conversion cost, ROAS tells you what came back per dollar, and contribution margin tells you whether any of it made money. Everything else on the dashboard is a diagnostic for one of those six. Impressions, reach and frequency explain a CPM change. Quality score and relevance explain a CTR change. They are not goals on their own.
What is a good ROAS?
It depends entirely on your gross margin, which is why the question has no industry answer. Breakeven ROAS is one divided by gross margin, so a business at 40 percent margin needs 2.5x just to cover the cost of goods, and more than that to cover overhead. A 3x on a 70 percent margin software product is comfortable. The same 3x on a 25 percent margin retail item loses money on every order. Work out your own breakeven first, then judge campaigns against it.
What is the difference between CPA and CAC?
CPA counts what a platform-attributed conversion cost inside that platform. CAC counts what a new customer cost across everything you spent to get them, including agency retainers, creative production, tools, print runs and the discounts you gave away. CPA is a bidding metric. CAC is a business metric, and it is always the larger number. Teams that report CPA to the board and call it CAC are understating what growth costs.
Why do my ad platforms report more conversions than my order system?
Because each platform claims any conversion that touched it inside its attribution window, and a buyer usually touches several. One sale can appear in a search report, a social report and an email report at once. The fix is not to argue about which platform is right. Set your order system as the single source of truth for how many sales happened, use platform numbers only to optimize inside that platform, and watch blended marketing efficiency, meaning total revenue divided by total ad spend, as the number that cannot be double counted.
How do I measure direct mail and print alongside paid ads?
Give each print piece its own tracked route back to you: a promo code that appears nowhere else, a short vanity URL or QR code with its own campaign tag, and a phone number used only on that piece. Then hold back a matched group who receive nothing. Redeemed codes give you a floor, because plenty of people who saw the piece will buy without using it. The gap between the mailed group and the holdout gives you the real lift, and dividing print plus postage by that lift gives you a cost per acquisition you can put next to a paid social number without flinching.
How long should I wait before judging a campaign?
Long enough to cover your sales cycle, and measured by the date you spent the money rather than the date the order landed. If most customers buy within three days, a week of data is a fair read. If the cycle runs six weeks, a campaign judged at day ten looks like a failure that is simply not finished yet. Group spend into weekly cohorts, let each cohort mature, and compare mature cohorts to each other. Comparing this week to last week while this week is still converting is the most common way good campaigns get killed early.
Get Started
Order 500 direct mail postcards at $0.18 each
Print a drop with its own code, its own QR destination and a holdout group, and you can put a cost per acquisition next to it in the next budget review.
Legal Disclaimer
Gold Standard guarantees apply to all standard orders placed through 4over4.com. Price match requires verifiable proof of a competitor's published price for an equivalent product with matching specifications and turnaround time. Satisfaction guarantee covers manufacturing defects and print quality issues. Contact support with order number and documentation. On-time delivery rate based on tracked orders 1999 to 2026. Individual results may vary based on shipping carrier performance.
